Figures & data
Table 1 Patient baseline demographics and disease characteristics
Figure 1A Patient flow through Part 1 of the study.
Notes: aIncluding four replacement patients. bPatients were replaced, with replacements starting from the next treatment planned to be administered to the withdrawn patients, such that there were 12 evaluable patients in each treatment period.
Abbreviation: ECG, electrocardiogram.
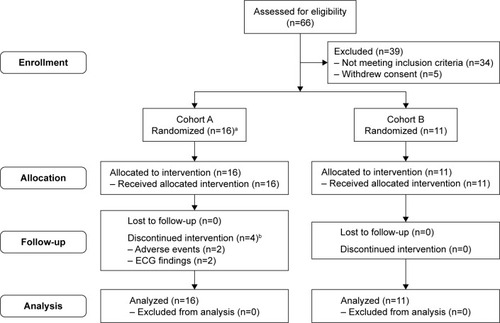
Figure 1B Patient flow through Part 2 of the study.
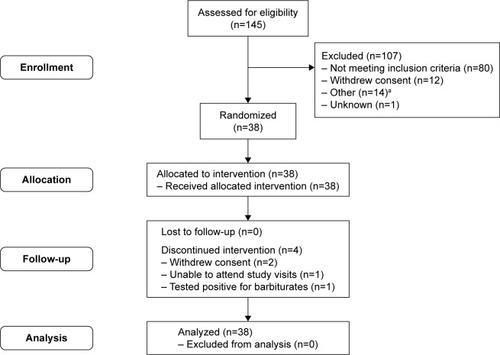
Figure 2 Study Part 1: Change from baseline in FEV1 AUC0–12h after a single dose.
Note: Data are mean and 95% CI.
Abbreviations: AUC, area under the curve; CI, confidence interval; GB, glycopyrronium bromide; FEV1, forced expiratory volume in 1 second; n, number of randomized patients.
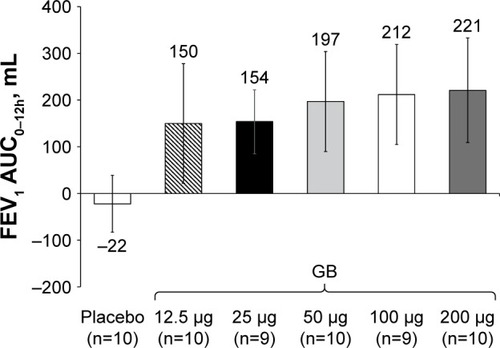
Figure 3 Study Part 1: Change from baseline in peak FEV1 after a single dose.
Abbreviations: CI, confidence interval; GB, glycopyrronium bromide; FEV1, forced expiratory volume in 1 second; n, number of randomized patients.
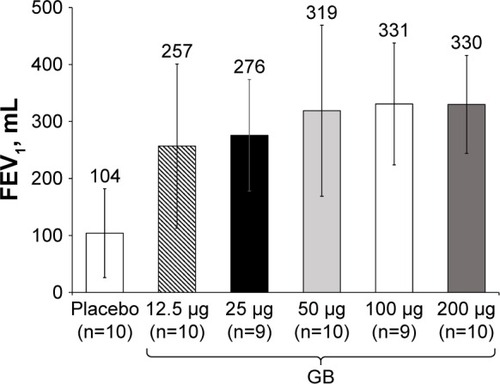
Figure 4 Study Part 2: Adjusted mean 12 h trough FEV1 on Day 7.
Abbreviations: BID, twice daily; CI, confidence interval; GB, glycopyrronium bromide; FEV1, forced expiratory volume in 1 second; n, number of randomized patients.
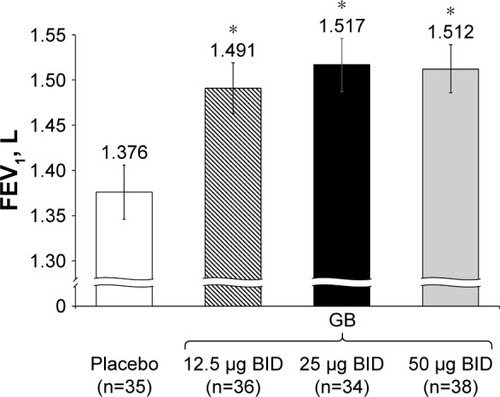
Figure 5 Study Part 2: Adjusted mean FEV1 AUC0–12h on Day 7.
Abbreviations: AUC, area under the curve; BID, twice daily; CI, confidence interval; FEV1, forced expiratory volume in 1 second; GB, glycopyrronium bromide; n, number of randomized patients.
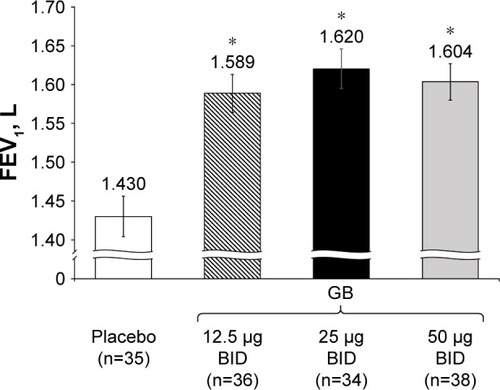
Figure 6 Study Part 2: Adjusted mean pre-dose morning FEV1 on Day 8.
Abbreviations: BID, twice daily; CI, confidence interval; FEV1, forced expiratory volume in 1 second; GB, glycopyrronium bromide; n, number of randomized patients; OD, once daily.
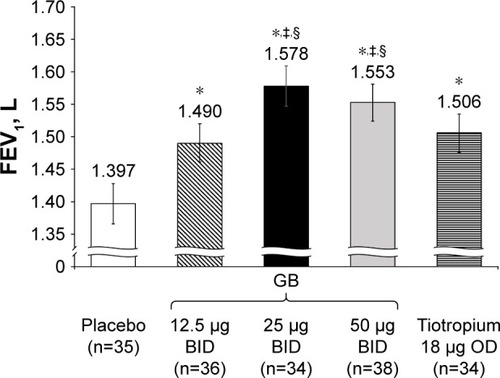
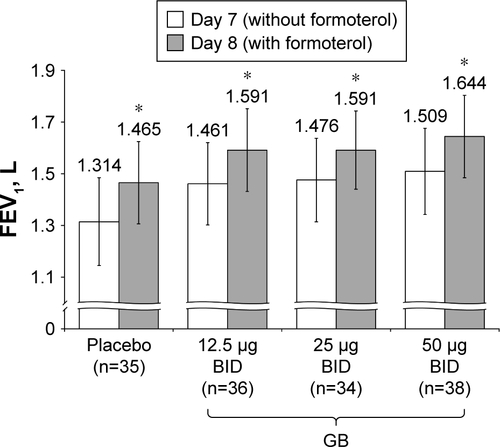
Figure 7 Study Part 2: Difference in peak FEV1 between Day 7 and Day 8, following administration of formoterol.
Notes: *P<0.001 versus Day 7. Data plotted are mean and 95% CI. Abbreviations: BID, twice daily; CI, confidence interval; GB, glycopyrronium bromide; FEV1, forced expiratory volume in 1 second; n, number of randomized patients.
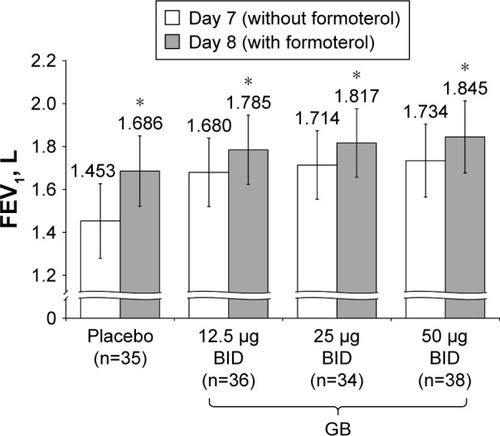
Figure 8 Study Part 2: Difference in FEV1 AUC0–12h between Day 7 and Day 8, following administration of formoterol.
Abbreviations: AUC, area under the curve; BID, twice daily; CI, confidence interval; GB, glycopyrronium bromide; FEV1, forced expiratory volume in 1 second; n, number of randomized patients.
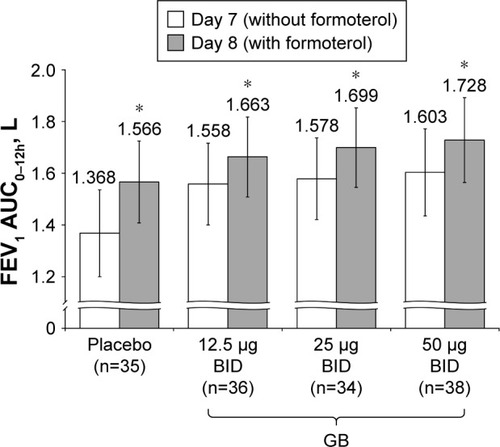
Table 2 Study Part 1: Overall experience of AEs and SAEs
Table 3 Study Part 2: Overall experience of AEs and SAEs
Table 4 Study Part 2: PK parameters of GB on Day 1 and Day 7
Figure S1 Study Part 2: Difference in 12 h trough FEV1 between Day 7 and Day 8, following administration of formoterol.
Notes: *P<0.001 versus Day 7. Data plotted are mean and 95% CI.
Abbreviations: BID, twice daily; CI, confidence interval; FEV1, forced expiratory volume in 1 second; GB, glycopyrronium bromide; n, number of randomized patients.