
Figures & data
Figure 1 Study framework and computational algorithms used in this study.
Abbreviations: DM, bacterial load in mice; DH, bacterial load in humans; CLM, level of inflammatory cytokines in mice; CLH, level of inflammatory cytokines in humans; KM, body-surface area-related transfer factors for mice; KH, body-surface area-related transfer factors for humans; IE, inflammatory effect; CLPna,2.5, the 2.5% tile of inflammatory cytokine levels estimated from patients with influenza-associated pneumonia; P(DH), prior probability; P(IE|DH), conditional probability; P(RCoI(IE)), posterior probability.
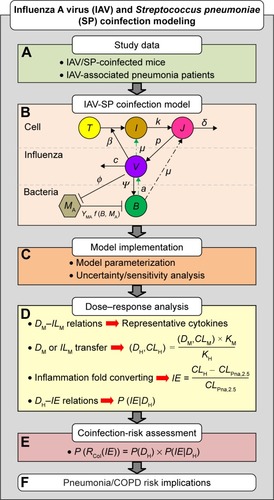
Table 1 Descriptions of governing equations used for influenza A virus and Streptococcus pneumoniae coinfection dynamic modelCitation15
Table 2 Parameter values used in influenza A virus and Streptococcus pneumoniae coinfection model
Figure 2 IAV and SP coinfection dynamics within hosts.
Abbreviations: IAV, influenza A virus; SP, Streptococcus pneumoniae.
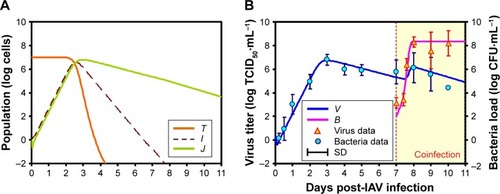
Table 3 Conversion of bacteria load and cytokine level between mice and humans and normalized inflammatory effect
Figure 3 Cytokine-specific inflammatory effects postcoinfection in response to various human bacteria loads.
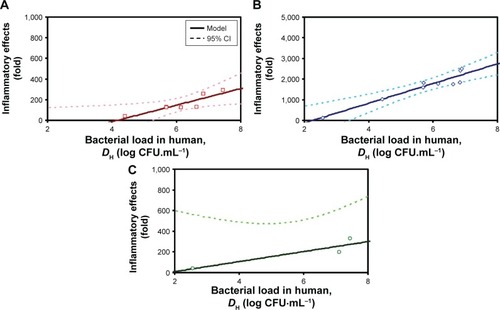
Figure 4 Sensitivity analysis represented with bacteria-load distributions corresponding to changes in IAV and SP coinfection-related parameters.
Abbreviations: IAV, influenza A virus; SP, Streptococcus pneumoniae; μ, toxic death of infected cells; a, virion production/release-increase rate; z, nonlinearity of virion production/release; φ, decrease in phagocytosis rate; KBV, half-saturation constant.
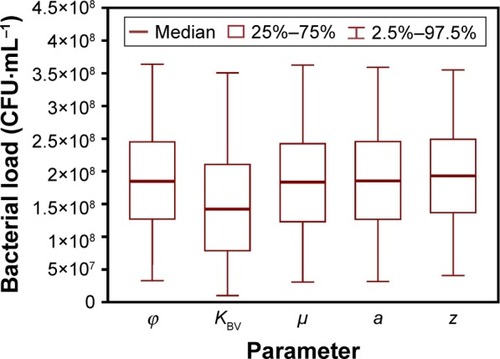
Figure 5 Bacteria-load estimates.
Abbreviations: IAV, influenza A virus; SP, Streptococcus pneumoniae.
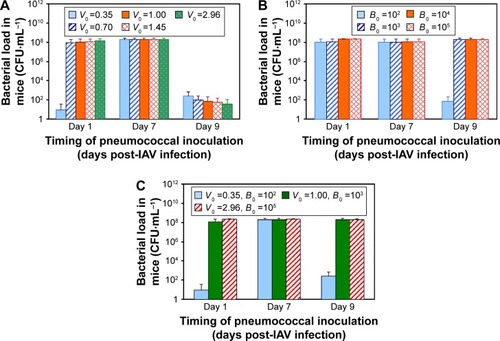
Figure 6 Human bacterial load and corresponded exceedance risk estimates due to coinfection.
Abbreviation: ER, exceedance risk.
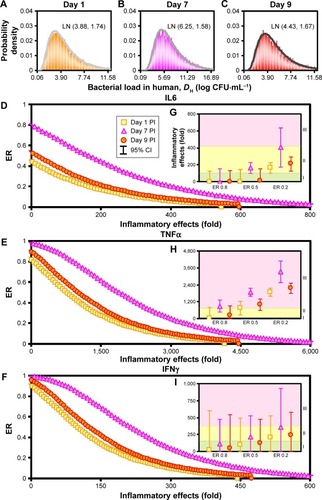
Figure S1 Relationships between bacterial loads and different cytokine levels.
Note: Linear regression analysis for various inflammatory cytokines (A) IL6, (B) IL10, (C) KC, (D) TNFα, and (E) IFNγ.
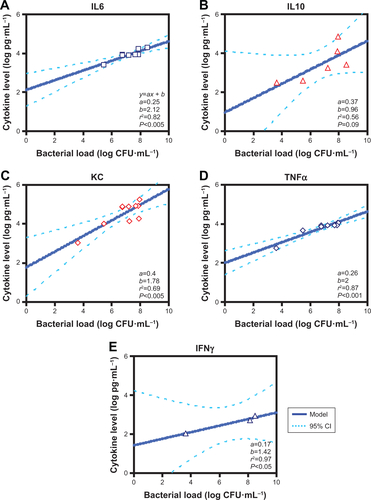
Table S1 Summary of extracted data for mice coinfected with IAV and SP from previously published studies
Table S2 Inflammatory cytokines in IAV-associated pneumonia patients
Table S3 IAV and SP coinfection-associated inflammatory effect (fold) varied with cytokines, day of introducing SP post-IAV infection, and exceedance risks at 0.8, 0.5, and 0.2