Figures & data
Table 1 Characterization of the study population
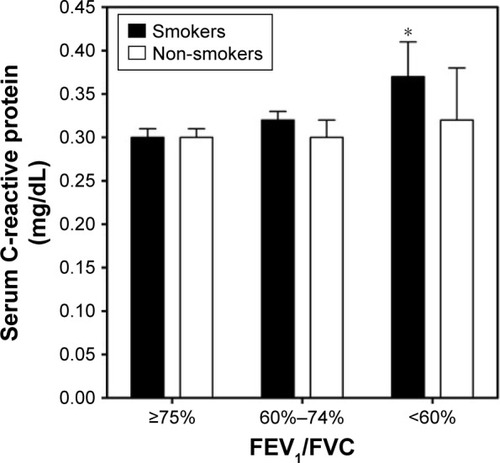
Figure 1 Changes in serum ferritin, iron, and transferrin saturation for smokers and non-smokers with age. Serum ferritin increased with age (A), whereas both serum iron (B) and transferrin saturation (C) decreased with age. Serum ferritin was elevated in smokers until 70 years of age, whereas serum iron and serum transferrin were elevated in smokers until 50 and 60 years of age, respectively.
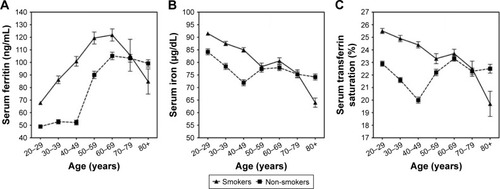
Table 2 Correlations between age, indices of iron homeostasis, and pulmonary function endpoints (n=7,251). Pearson product-moment correlation coefficients and P-values are provided
Table 3 Correlations between age, indices of iron homeostasis, and pulmonary function endpoints for smokers (n=2,549). Pearson product-moment correlation coefficients and P-values are provided
Table 4 Correlations between age, indices of iron homeostasis, and pulmonary function endpoints for non-smokers (n=4,702). Pearson product-moment correlation coefficients and P-values are provided
Figure 2 Indices of iron homeostasis change with FEV1/FVC. Serum ferritin (A) significantly increased in both smokers and non-smokers with FEV1/FVC values ranging from 60% to 74% and less than 60%, respectively. However, comparable elevation in serum iron (B) and transferrin saturation (C) among those with FEV1/FVC values from 60% to 74% and less than 60%, respectively, were observed to be significant only in non-smokers. *Significant difference relative to that group (smokers and non-smokers) with FEV1/FVC ≥75%.
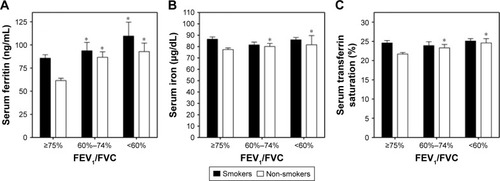
Figure 3 C-reactive protein among smokers and non-smokers with varying FEV1/FVC. C-reactive protein was increased in smokers with the lowest values of FEV1/FVC, but there were no differences among non-smokers with and without obstruction. *Significant difference relative to smokers with FEV1/FVC ≥75%.