
Figures & data
Figure 1 Graphical representation of a flow-volume loop indicating the traditional parameters (FEV1 and FVC) and the various flow parameters measured at intervals throughout the forced expiratory curve.
Abbreviations: FEV1, the forced expiratory volume in one second; FVC, forced vital capacity; MMEF, maximal mid-expiratory flow; MEF25, maximal expiratory flow when 25% of FVC remains; MEF50, maximal expiratory flow when 50% of FVC remains; MEF75, maximal expiratory flow when 75% of FVC remains; PEF, peak expiratory flow.
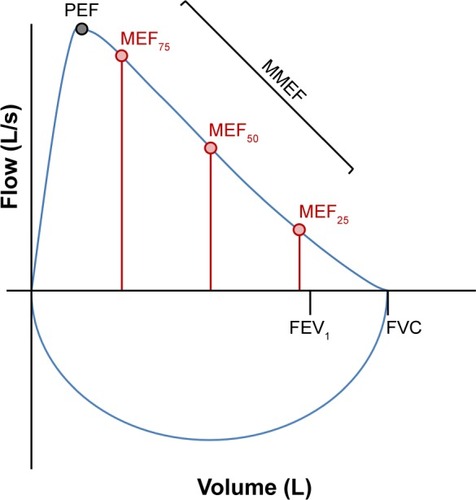
Figure 2 A typical plot of exhaled volume versus nitrogen concentration (N2 %) obtained during the single breath nitrogen washout test.
Note: Stages I–IV (including the Phase III slope) are indicated, and the volume relationship between CV, CC, RV and TLC is also shown.
Abbreviations: CC, closing capacity; CV, closing volume; RV, residual volume; TLC, total lung capacity.
Abbreviations: CC, closing capacity; CV, closing volume; RV, residual volume; TLC, total lung capacity.
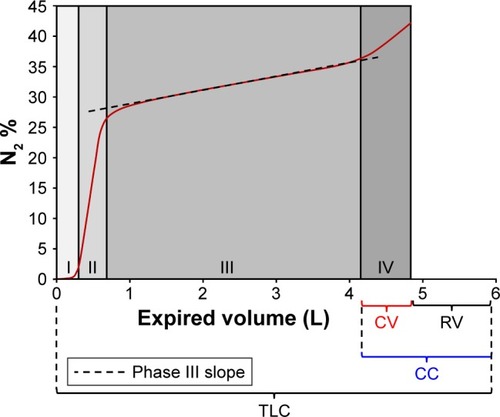
Figure 3 A typical sRaw loop in a patient with airflow obstruction, where shift volume is plotted against airflow.
Note: Hysteresis due to airflow obstruction highlights the differential derivation of sRaw using the sReff, sRtot and sR0.5 methods in these patients.
Abbreviations: sRaw, specific airway resistance; sReff, specific effective resistance; sRtot, specific total resistance; sR0.5, specific resistance at the flow of 0.5 litres per second.
Abbreviations: sRaw, specific airway resistance; sReff, specific effective resistance; sRtot, specific total resistance; sR0.5, specific resistance at the flow of 0.5 litres per second.
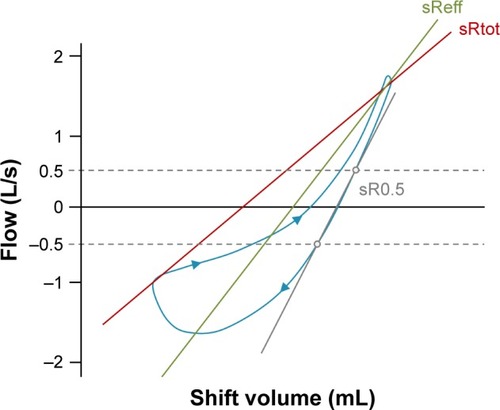
Figure 4 sRtot percentage predicted in 254 AATD patients with normal spirometry and varying degrees of airflow obstruction: mild (GOLD Stage I), moderate (GOLD Stage II), severe (GOLD Stage III) and very severe (GOLD Stage IV).
Note: *Significantly different from patients with normal spirometry (P<0.001).
Abbreviations: AATD, alpha-1 antitrypsin deficiency; GOLD, the Global Initiative for Chronic Obstructive Lung Disease; sRtot, specific total resistance.
Abbreviations: AATD, alpha-1 antitrypsin deficiency; GOLD, the Global Initiative for Chronic Obstructive Lung Disease; sRtot, specific total resistance.
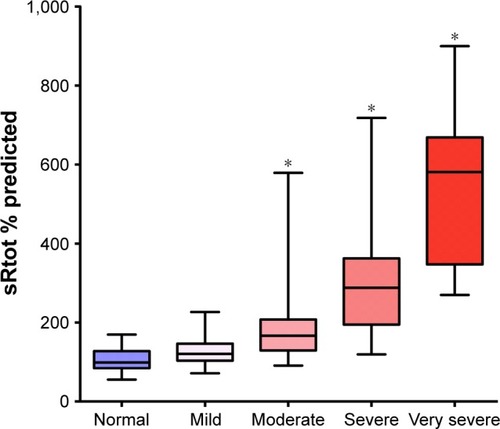
Table 1 Methodologies to assess small airways function