Figures & data
Table 1 Baseline characteristics of the patients
Table 2 Lung volumes and densitometry of the patients
Figure 1 Example of a sagittal reconstruction of corresponding planes of the left lung in inspiration (In 1, In 2) and expiration (Ex 1, Ex 2).
Notes: Although densitometric parameters in inspiration indicate a slightly higher degree of destruction in the UL in comparison to the LL (UL vs LL: MLD [HU] −889 vs −881; LAV [% <−950 HU] 18.4 vs 15.3; 15%P [HU] −949 vs −945) there is a higher deflation during expiration in the UL compared to the LL (UL vs LL: LVC/LTC 0.43 vs 0.25). This example illustrates a huge diversity of volume changes between lobes with almost equal inspiratory densitometric parameters. Based on inspiratory densitometric parameters the target for lung volume reduction would have been the upper lobe. In contrast the lower deflation of the LL indicates to treat this lobe.
Abbreviations: 15%P, 15th percentile of Hounsfield units; HU, Hounsfield unit; LAV, low attenuation value; LL, lower lobe; LVC/LTC, lobar vital capacity/lobar total capacity; MLD, mean lung density; UL, upper lobe.
Abbreviations: 15%P, 15th percentile of Hounsfield units; HU, Hounsfield unit; LAV, low attenuation value; LL, lower lobe; LVC/LTC, lobar vital capacity/lobar total capacity; MLD, mean lung density; UL, upper lobe.
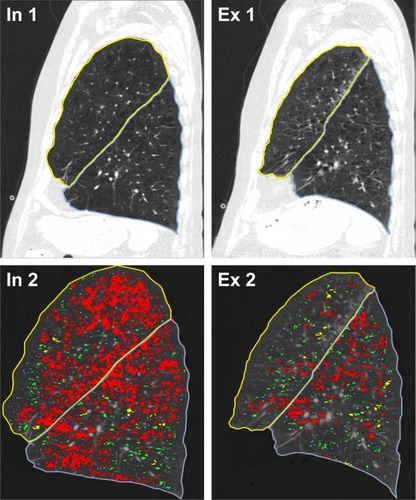
Figure 2 Correlation coefficients (cc) between LVC/LTC and iMLD, iLAV, and i15%P [HU] in different shading, indicating the grade of correlation.
Notes: Every dot represents one lobe. Parameters of all four measured lobes (right UL, right LL, left UL, and left LL) of every patient are given.
Abbreviations: HU, Hounsfield unit; i15%P, inspiratory 15th percentile of Hounsfield units; iLAV, inspiratory low attenuation value; iMLD, inspiratory mean lung density; LL, lower lobe; LVC/LTC, lobar vital capacity/lobar total capacity; UL, upper lobe.
Abbreviations: HU, Hounsfield unit; i15%P, inspiratory 15th percentile of Hounsfield units; iLAV, inspiratory low attenuation value; iMLD, inspiratory mean lung density; LL, lower lobe; LVC/LTC, lobar vital capacity/lobar total capacity; UL, upper lobe.
![Figure 2 Correlation coefficients (cc) between LVC/LTC and iMLD, iLAV, and i15%P [HU] in different shading, indicating the grade of correlation.](/cms/asset/764c47c0-b4aa-4a45-9087-591875bbee7e/dcop_a_139304_f0002_b.jpg)
Figure 3 cc between LVC/LTC and eMLD, eLAV, and e15%P [HU] in different shading, indicating the grade of correlation.
Notes: Every dot represents one lobe. Parameters of all four measured lobes (right UL, right LL, left UL, and left LL) of every patient are given.
Abbreviations: cc, correlation coefficient; e15%P, expiratory 15th percentile of Hounsfield units; eLAV, expiratory low attenuation value; eMLD, expiratory mean lung density; HU, Hounsfield unit; LL, lower lobe; LVC/LTC, lobar vital capacity/lobar total capacity; UL, upper lobe.
Abbreviations: cc, correlation coefficient; e15%P, expiratory 15th percentile of Hounsfield units; eLAV, expiratory low attenuation value; eMLD, expiratory mean lung density; HU, Hounsfield unit; LL, lower lobe; LVC/LTC, lobar vital capacity/lobar total capacity; UL, upper lobe.
![Figure 3 cc between LVC/LTC and eMLD, eLAV, and e15%P [HU] in different shading, indicating the grade of correlation.](/cms/asset/3c38c72d-faab-445f-ad3d-225f9aa2eaa8/dcop_a_139304_f0003_b.jpg)
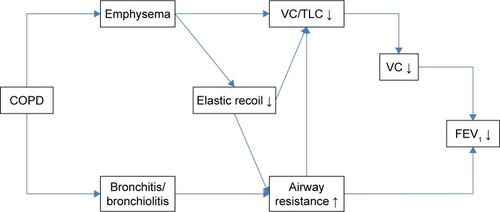
Figure 4 Pathophysiology of emphysema.
Note: ↓ means decrease and ↑ means increase.
Abbreviations: COPD, chronic obstructive pulmonary disease; FEV1, forced expiratory volume in the first second; TLC, total lung capacity; VC, vital capacity.
Abbreviations: COPD, chronic obstructive pulmonary disease; FEV1, forced expiratory volume in the first second; TLC, total lung capacity; VC, vital capacity.