
Figures & data
Figure 1 Example of continuous mean lung density measurements in the right upper lobe using PhyZiodynamics software (Ziosoft Inc., Minato-ku, Tokyo, Japan).
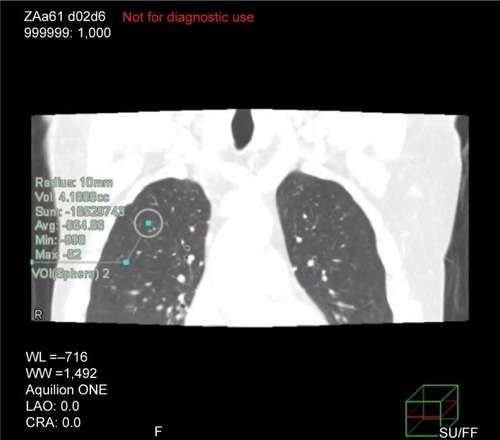
Table 1 Clinical characteristics of 32 subjects
Table 2 Measurements of lung density and correlations to FEV1.0/FVC
Table 3 Cross-correlation coefficients between two MLD curves of the right and left lungs and those of paired lung lobes and their correlations to FEV1.0/FVC
Figure 2 Mean lung density (MLD) time curves of the right and left lungs.
Abbreviations: FEV1.0/FVC, forced expiratory volume in one second/forced vital capacity; LAV%, percentage low attenuation volume (<−950 HU).
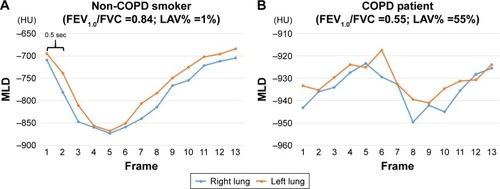
Figure 3 Mean lung density (MLD) time curves of three lung lobes in the right lung.
Notes: In a smoker without COPD (A), the three MLD time curves of the three lung lobes have similar shapes, which indicates synchronous respiratory movements of the lobes (cross-correlation coefficient [CCC] of three pairs =0.975–0.996). A larger change in MLD in the lower lobe than in the upper and middle lobes suggests that respiratory volume changes mainly occur in the lower lobe in this subject. In a severe COPD patient (B), the three MLD time curves are unmatched, resulting in uncertain inspiratory/expiratory movements. Note that nearly opposite MLD curves of the middle and lower lobes are observed (CCC =−0.135), suggesting that asynchronized respiratory airflow exists in this patient.
Abbreviations: FEV1.0/FVC, forced expiratory volume in one second/forced vital capacity; LAV%, percentage low attenuation volume (<−950 HU); RUL, right upper lobe; RML, right middle lobe; RLL, right lower lobe.
![Figure 3 Mean lung density (MLD) time curves of three lung lobes in the right lung.Notes: In a smoker without COPD (A), the three MLD time curves of the three lung lobes have similar shapes, which indicates synchronous respiratory movements of the lobes (cross-correlation coefficient [CCC] of three pairs =0.975–0.996). A larger change in MLD in the lower lobe than in the upper and middle lobes suggests that respiratory volume changes mainly occur in the lower lobe in this subject. In a severe COPD patient (B), the three MLD time curves are unmatched, resulting in uncertain inspiratory/expiratory movements. Note that nearly opposite MLD curves of the middle and lower lobes are observed (CCC =−0.135), suggesting that asynchronized respiratory airflow exists in this patient.Abbreviations: FEV1.0/FVC, forced expiratory volume in one second/forced vital capacity; LAV%, percentage low attenuation volume (<−950 HU); RUL, right upper lobe; RML, right middle lobe; RLL, right lower lobe.](/cms/asset/37b37b80-ac54-478f-9f5d-0cd70087b6be/dcop_a_140247_f0003_c.jpg)
Figure 4 Correlation between spirometric value (FEV1.0/FVC) and mean cross-correlation coefficient (CCC) from six pairs of lung lobes.
Abbreviation: FEV1.0/FVC, forced expiratory volume in one second/forced vital capacity.
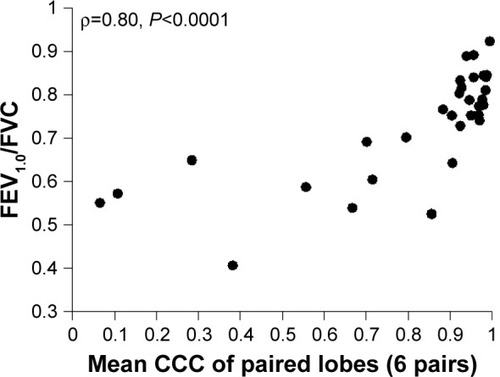
Table 4 Correlation between cross-correlation coefficient of paired MLD curves and emphysema index of the whole lung