Figures & data
Table 1 Baseline demographic characteristics of study subjects with COPD
Table 2 Treatment effectiveness in COPD patients with allergic phenotypes
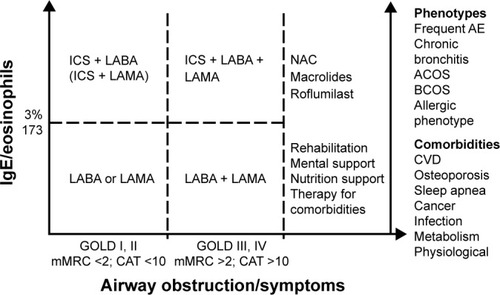
Figure 1 ROC curves for eosinophil + IgE, IgE, eosinophil, and LEE in patients with chronic obstructive pulmonary disease.
Abbreviations: eosino, eosinophil; IgE, immunoglobulin E; LEE, lower eosinophil and IgE group; ROC, receiver operating characteristic.
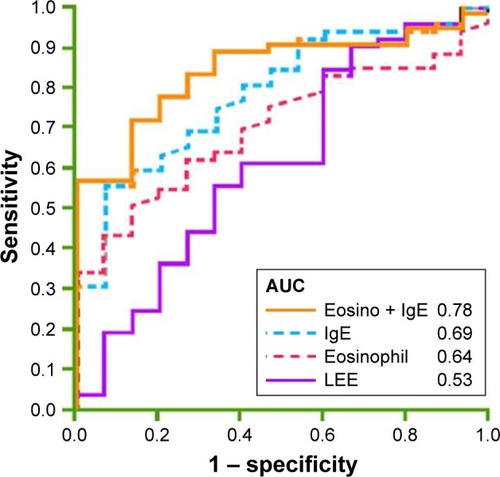
Figure 2 Chronic obstructive pulmonary disease treatment strategy, including lung function, symptoms, serum biomarkers, phenotypes, and comorbidities.
Abbreviations: ACOS, asthma-COPD overlap syndrome; AE, acute exacerbation; BCOS, bronchiectasis-COPD overlay syndrome; CAT, COPD Assessment Test; CVD, cardiovascular disease; GOLD, Global Initiative for Chronic Obstructive Lung Disease; ICS, inhaled corticosteroids; IgE, immunoglobulin E; LABA, long-acting β-agonist; LAMA, long-acting muscarinic antagonist; mMRC, modified Medical Research Council; NAC, N-acetylcysteine.