
Figures & data
Table 1 Demographic data, ABG, and lung function parameters
Table 2 Comparison of PaO2 and PcO2 in all patients (primary outcome)
Figure 1 Bland–Altman comparison of PaO2 and PcO2 for PcO2 values ≤60 mmHg (primary outcome, n=102).
Abbreviations: PaO2, partial pressure of arterial oxygen (in mmHg); PcO2, partial pressure of capillary oxygen.
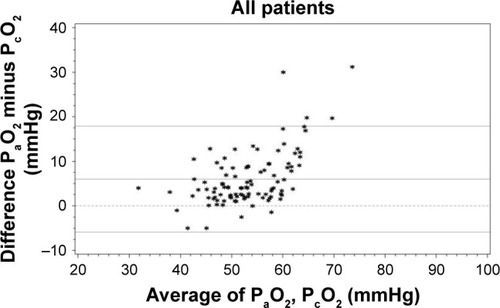
Table 3 Comparison of blood gas measurements and peripheral saturation measurements for PcO2 ≤55 mmHg (secondary outcome)
Figure 2 Bland–Altman comparison of PaO2 and PcO2 for PcO2 values ≤55 mmHg (secondary outcome, n=73).
Abbreviations: PaO2, partial pressure of arterial oxygen (in mmHg); PcO2, partial pressure of capillary oxygen.
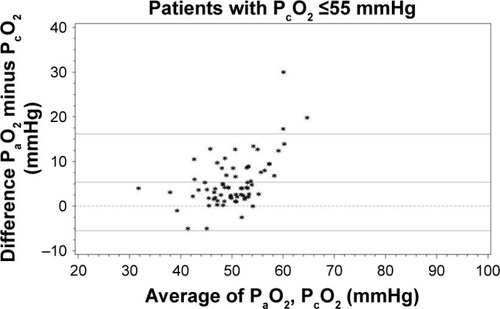
Table 4 Comparison of blood gas measurements and peripheral saturation measurements in all patients (secondary outcome)
Table 5 Comparison of PaO2 and PcO2 with respect to PcO2-based indication of LTOT
Table 6 Assessment of pain associated with blood gas analyses