
Figures & data
Table 1 Characteristics of the study population
Figure 1 Lifetime prevalence (%) of comorbid conditions.
Notes:
aHeart disease: including cardiac arrhythmia, cardiac insufficiency, narrow coronary vessel, and angina pectoris. bPsychiatric disorder: including anxiety, depression, and psychosis. cMental deficiency: including weakness of memory, restlessness, disorientation, and confusion. dOther lung disease: fibrosis, sarcoidosis, and bronchiectasis.
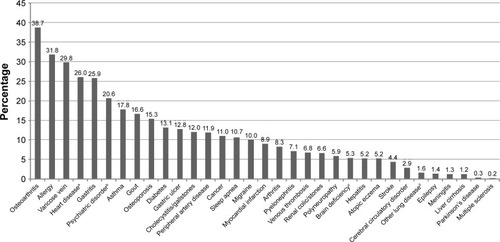
Table 2 Unadjusted mean annual direct and indirect costs
Table 3 Results of multivariate regression models for direct and indirect costs
Table 4 Interactions between COPD stage, comorbidities, and dyspnea for annual direct or indirect costs
Figure 2 Adjusted mean total direct or indirect costs (€) per year for subgroups.
Note: Means were adjusted according to regression models shown in .
Abbreviations: GOLD, Global initiative for Obstructive Lung Disease; mMRC, modified Medical Research Council.
Abbreviations: GOLD, Global initiative for Obstructive Lung Disease; mMRC, modified Medical Research Council.
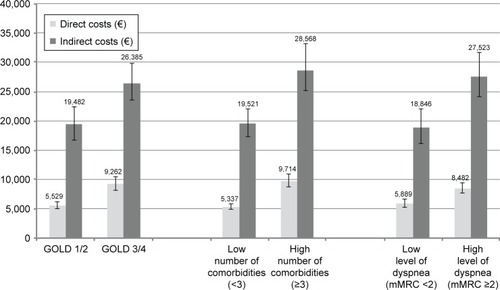
Table S1 German unit costs