Figures & data
Table 1 Airway replica volumes and surface areas for 15 adult nasal airway replicas
Figure 1 Solid 3D nose–throat airways of the 15 replicas tested in the present study.
Abbreviations: CT, computed tomography; MRI, magnetic resonance imaging.
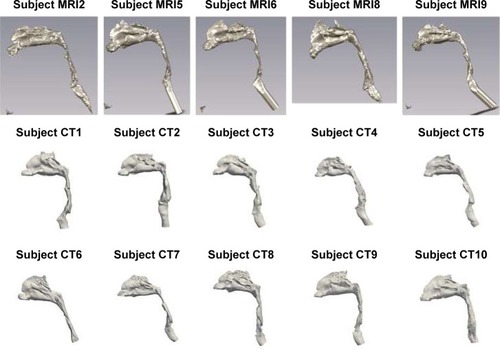
Figure 2 Schematic of experimental apparatus.
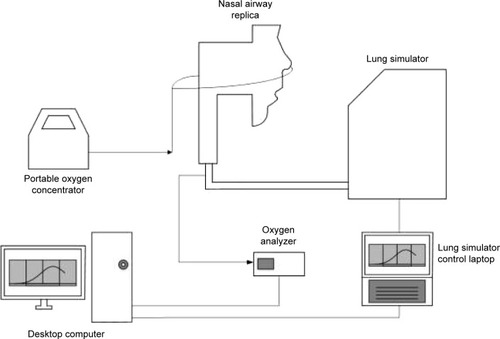
Table 2 Breathing parameters of representative breathing profiles for COPD patients at rest, doing light exercise, and while asleep
Table 3 SimplyGo oxygen pulse characteristics at pulse flow setting numbers of 2.0 and 6.0 using various breathing frequencies
Figure 3 Example of oxygen mole fraction and flow rate waveforms indicating (A) steady flow oxygen delivery, (B) complete pulse delivery, and (C) incomplete pulse delivery.
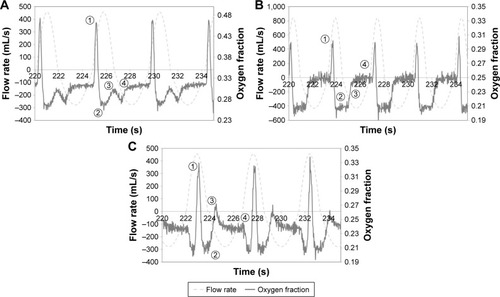
Table 4 Number of breathing replicas indicating incomplete pulse delivery out of the total number of replicas used to calculate volume-averaged fraction of inspired oxygen (FiO2) at each setting/breathing pattern combination
Figure 4 Comparison of volume-averaged FiO2 at SF 2.0 L/min and PF setting number 2.0, averaged over n different airway replicas, measured using five successive breaths per replica.
Notes: For exercise and rest breathing patterns, n=15. For the sleep breathing pattern combined with pulse mode, n=12; with sleep mode, n=14. Error bars indicate one standard deviation.
Abbreviations: FiO2, fraction of inspired oxygen; SF, steady flow; PF, pulse flow.
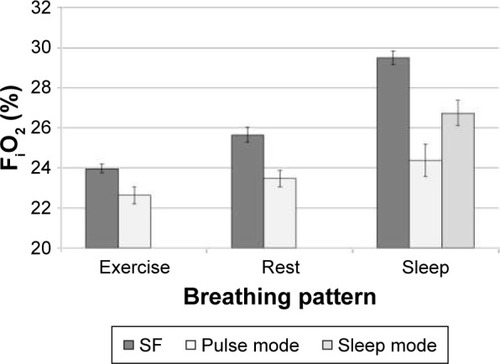
Figure 5 Comparison of volume-averaged FiO2 at SF 6.0 L/min and PF setting number 6.0, averaged over n different airway replicas, measured using five successive breaths per replica.
Abbreviations: FiO2, fraction of inspired oxygen; SF, steady flow; PF, pulse flow.
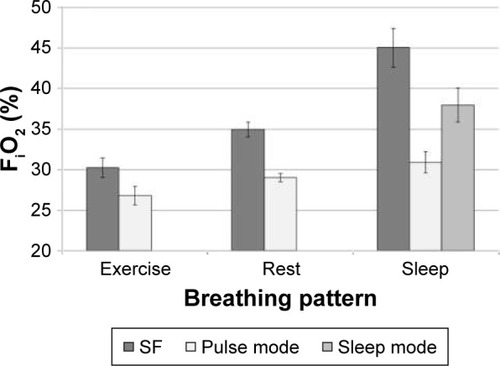
Figure 6 Pressure drop measured at the cannula as a function of inspiratory flow rate, averaged over three measurements for all 5 MRI subjects.
Abbreviations: CT, computed tomography; MRI, magnetic resonance imaging.
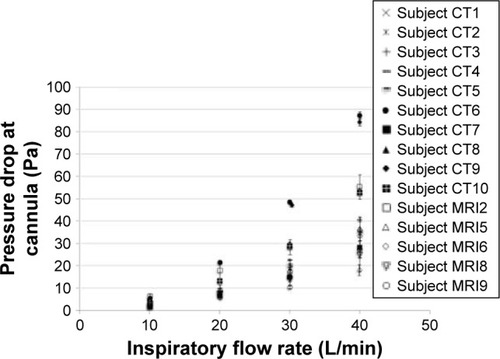
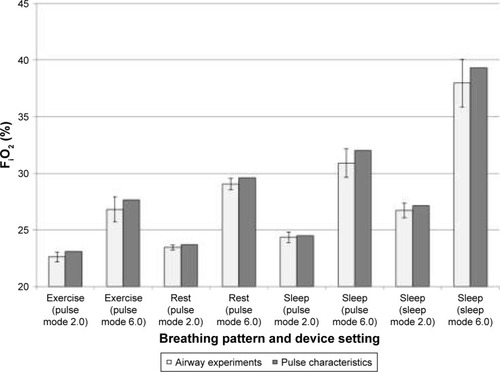
Figure 7 Comparison of volume-averaged FiO2 estimated from airway experiments and FiO2 predicted using pulse characteristics.
Abbreviation: FiO2, fraction of inspired oxygen.