Figures & data
Table 1 Patient demographics and baseline characteristics
Table 2 Spirometry results of the patients
Table 3 Results of induced sputum cells of the patients
Table 4 Results of induced sputum cells in the stage of COPD, ACO and asthma
Figure 1 Scatter plots of correlations between sputum eosinophils, BHR and bronchodilator reversibility.
Notes: (A) Correlation between the percentage of sputum eosinophils and PD20 (mg). (B) Correlation between the percentage of sputum eosinophils and ΔFEV1 (mL); Δ, improvement in FEV1 after 400 μg of salbutamol.
Abbreviations: BHR, bronchial hyperresponsiveness; FEV1, forced expiratory volume in 1 second; PD20, provocative dose.
Abbreviations: BHR, bronchial hyperresponsiveness; FEV1, forced expiratory volume in 1 second; PD20, provocative dose.
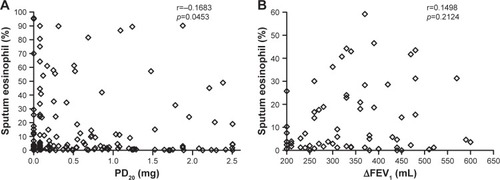
Table 5 Results of ROC analysis of induced sputum cells in the discovery cohort
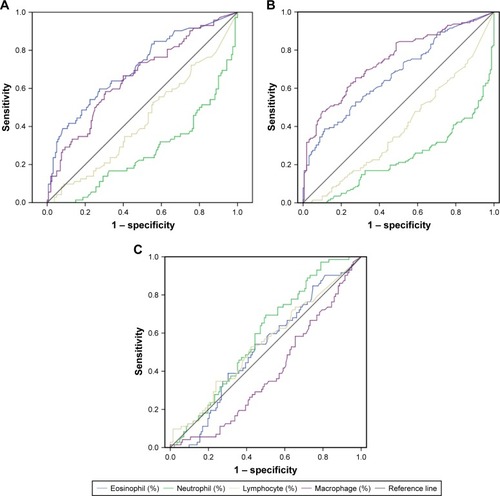
Figure 2 ROC curve for induced sputum cell counts in ACO versus COPD (A), asthma versus COPD (B), ACO versus asthma (C).
Abbreviations: ACO, asthma–COPD overlap; ROC, receiver operating characteristic.