Figures & data
Table 1 Characteristics of study subjects. Results reported as mean ± SD
Figure 1 Recruitment flowchart for study participants.
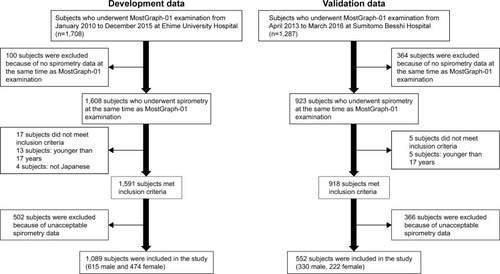
Table 2 Correlations between spirometry and MostGraph-01 data
Table 3 Regression coefficients for parameters predictive of vital capacity
Table 4 Regression coefficients for parameters predictive of forced vital capacity
Table 5 Regression coefficients for parameters predictive of forced expiratory volume in 1 second
Table 6 Correlations between actual and estimated data, and performance of estimation equations
Figure 2 Correlations between actual and estimated VC, FVC, and FEV1 in the development and validation study.
Notes: Estimated data obtained using Equationequation 1Equation 1 (A–C) and Equationequation 2
Equation 2 (D–F) in the development study. Using Equationequation 2
Equation 2 , we calculated estimated data in the validation data set (G–I).
Abbreviations: VC, vital capacity; FVC, forced VC; FEV1, forced expiratory volume in 1 second.
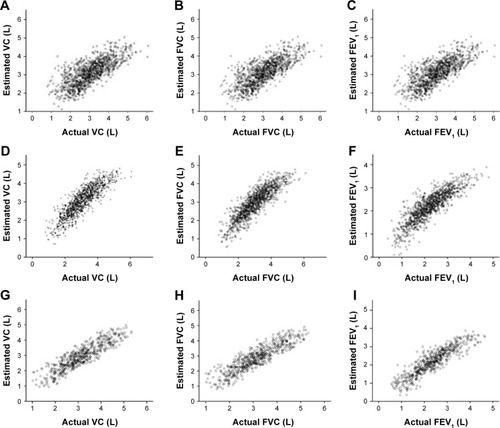
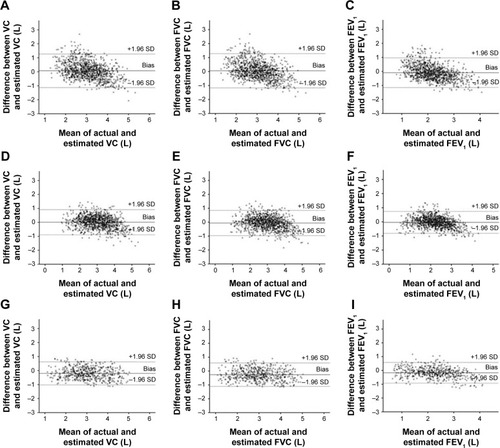
Figure 3 Bland–Altman plot comparing actual and estimated VC, FVC, and FEV1.
Abbreviations: VC, vital capacity; FVC, forced VC; FEV1, forced expiratory volume in 1 second.