
Figures & data
Table 1 Clinical characteristics of the 31 study subjects
Table 2 CT-based indices in COPD patients versus non-COPD smokers
Figure 1 A 39-year-old male current smoker without COPD underwent dynamic-ventilation CT for preoperative analysis of parietal pleural adhesion caused by a benign rib tumor.
Notes: His FEV1.0/FVC was 0.92. Inspiratory (A) and expiratory phases (B) (both shown in coronal view, MIP images) demonstrated an increase in heart size during expiration, mainly due to diaphragm elevation.
Abbreviations: CT, computed tomography; FEV1.0, forced expiratory volume in 1 s; FVC, forced vital capacity; MIP, maximum intensity projection.
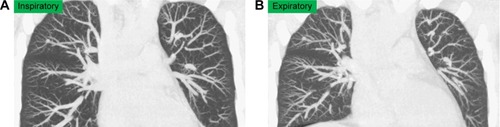
Figure 2 A 70-year-old male with COPD underwent dynamic-ventilation CT to evaluate central airway abnormalities.
Abbreviations: CT, computed tomography; FEV1.0, forced expiratory volume in 1 s; FVC, forced vital capacity.
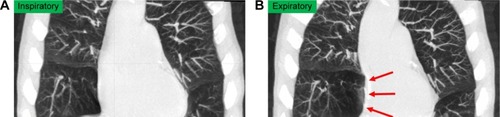
Table 3 CCC between the maximum cardiac CSA and MLD on dynamic-ventilation CT
Figure 3 Measurements of MLD and maximum cardiac CSA.
Abbreviations: CCC, cross-correlation coefficient; CSA, cross-sectional area; CT, computed tomography; HU, Hounsfield unit; MLD, mean lung density.
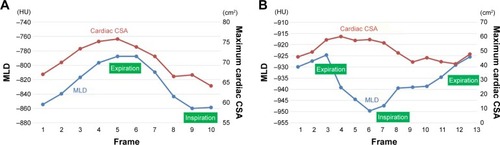
Table 4 Correlations between the CTR on dynamic-ventilation CT and FEV1.0/FVC