
Figures & data
Figure 1 Flowchart of the study population.
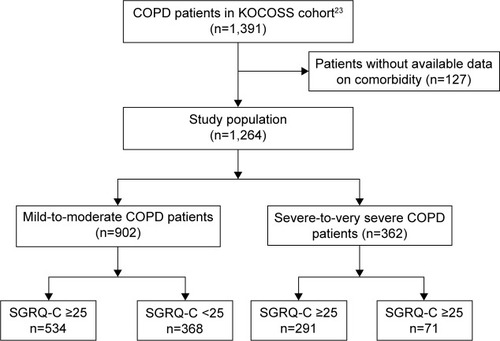
Figure 2 Correlation between SGRQ-C total score and post-BD FEV1 (% predicted) in patients with mild-to-moderate COPD.
Abbreviations: BD, bronchodilator; COPD, chronic obstructive pulmonary disease; FEV1, forced expiratory volume in one second; SGRQ-C, St George’s Respiratory Questionnaire for COPD.
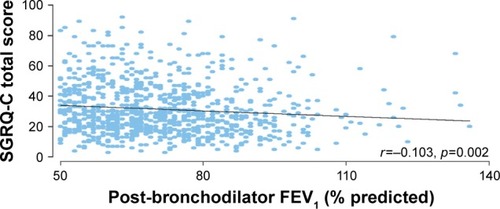
Figure 3 Correlation between SGRQ-C total score and post- BD FEV1 (% predicted) in patients with severe-to-very severe COPD.
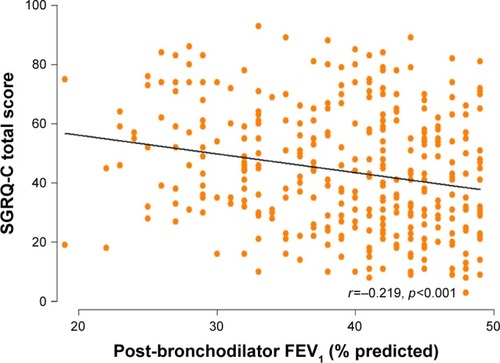
Table 1 Clinical characteristics of mild-to-moderate COPD patients according to SGRQ-C score
Table 2 Clinical characteristics of severe-to-very severe COPD patients according to SGRQ-C score
Table 3 Multivariate logistic regression analysis of the factors associated with high SGRQ-C score (SGRQ-C score ≥25) in mild-to-moderate COPD patients
Table 4 Multivariate logistic regression analysis of the factors associated with high SGRQ-C score (SGRQ-C score ≥25) in severe-to-very severe COPD patients