
Figures & data
Figure 1 Flow diagram of selection process.
Abbreviations: MEC, Mobile Examination Center; NHANES, National Health and Nutrition Examination Survey.
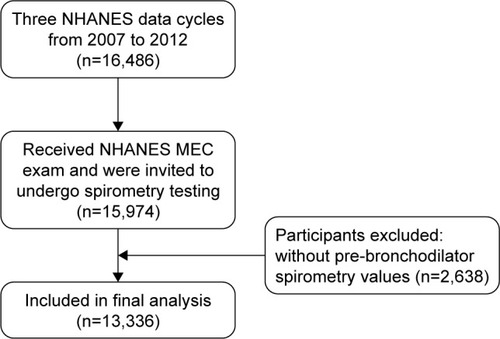
Table 1 Demographic characteristics and occupational exposure of subjects with and without COPD
Table 2 Logistic regression analysis of factors associated with occupational exposure and COPD
Table 3 Associations between occupational exposure and COPD by FeNO levels (cutoff point: 50 ppb)Table Footnotea
Table 4 Associations between FeNO >50 ppb and occupational exposure in respondents with COPD