Figures & data
Table 1 Clinical characteristics of patients in the death group and survival group
Table 2 Variables associated with all-cause mortality of COPD in a Cox proportional hazard regression model
Table 3 Differences in clinical characteristics between patients of smoking-cessation group and continuing-smoking group
Table 4 Causes of patient death in smoking-cessation group and continuing-smoking group
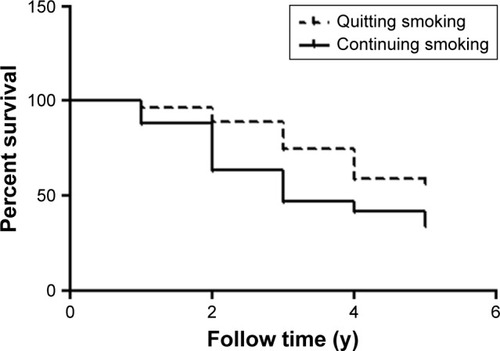
Figure 1 Kaplan–Meier survival curves for COPD patients in the quitting-smoking group (n=92; 40 deaths) and continuing-smoking group (n=112; 73 deaths).
Notes: Patients in the quitting-smoking group had lower survival than those in the continuing-smoking group. There was a significant difference between the two groups (log-rank test, 13.59; P=0.0002).