Figures & data
Table 1 Baseline data of included patients
Table 2 Univariate logistic regression analysis of concealed CRF
Table 3 Multivariable logistic regression analysis of concealed CRF
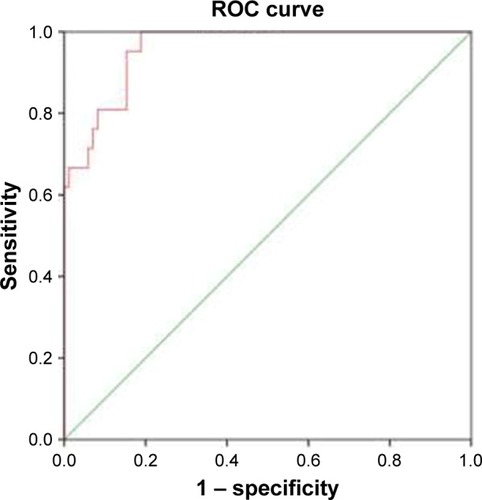
Figure 1 ROC curves for ADAMTS-13 in predicting concealed CRF in COPD patients. The area under the ROC curve was 0.959. Sensitivity and specificity at an ADAMTS-13 cutoff of 318.72 ng/mL were 100% and 81.2%, respectively.
Abbreviations: ADAMTS-13, a disintegrin and metalloproteinase with a thrombospondin type 1 motif, member 13; CRF, chronic renal failure; ROC, receiver operating characteristic.