Figures & data
Table 1 Demographics and clinical characteristics of COPD patients in the two phenotypes
Figure 1 (A) The spectrum shows a wide range of metabolites. Representative 1H-NMR spectrum of plasma samples obtained from (B) phenotype E pretreatment, (C) phenotype E posttreatment, (D) phenotype M pretreatment and (E) phenotype M posttreatment.
Abbreviation:
1H-NMR, 1H nuclear magnetic resonance spectroscopy.
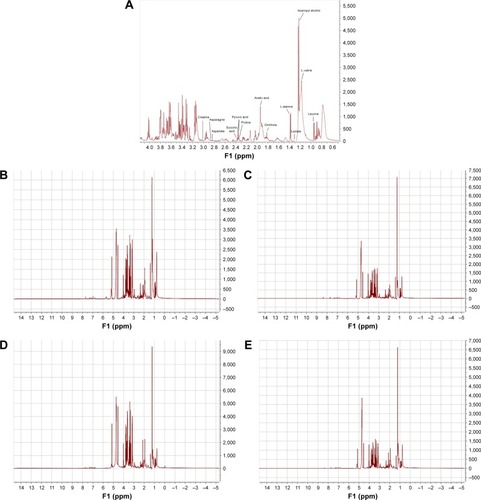
Figure 2 PCA (A–D) and PLS-DA (E–H) score plots demonstrated good separation between different groups.
Note: Ellipses display 95% confidence regions.
Abbreviations: EH, phenotype E posttreatment; EQ, phenotype E pretreatment; MH, phenotype M posttreatment; MQ, phenotype M pretreatment; PCA, principal component analysis; PLS-DA, partial least squares discriminant analysis.
Abbreviations: EH, phenotype E posttreatment; EQ, phenotype E pretreatment; MH, phenotype M posttreatment; MQ, phenotype M pretreatment; PCA, principal component analysis; PLS-DA, partial least squares discriminant analysis.
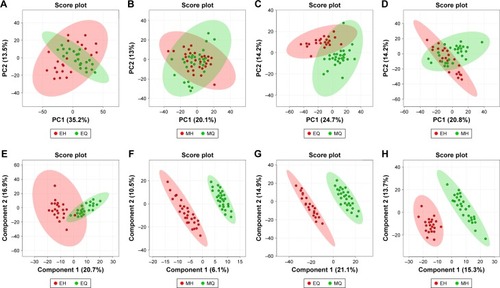
Table 2 Summary of the parameters for assessing the quality of the PLS-DA model
Table 3 Quantitative comparison and the relative integrals of metabolites in the EQ, MQ, EH and MH groups
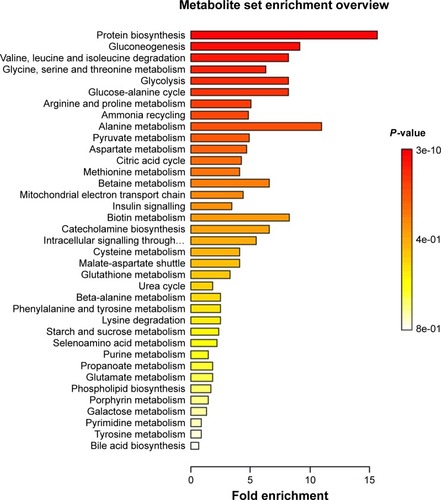
Figure 3 Results of the MSEA for COPD patients.
Notes: The horizontal bar graph shows the most affected metabolic pathways. The most significant differences include protein biosynthesis, amino acid metabolism, gluconeogenesis and glycolysis.
Abbreviation: MSEA, metabolite set enrichment analysis.
Abbreviation: MSEA, metabolite set enrichment analysis.