Figures & data
Table 1 Demographic and clinical characteristics of study population (“risk population”)
Figure 1 Patient selection.
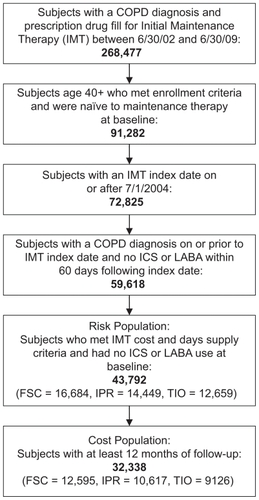
Table 2 Results from Cox proportional hazard analyses examining risk of COPD exacerbations between study cohorts (“risk population”)
Figure 2 Time to any eventa Kaplan–Meier survival curve: Initial maintenance therapy with FSC, tiotropium, or ipratropium.b,c
Abbreviation: COPD, chronic obstructive pulmonary disease; FSC, fluticasone propionate/salmeterol combination.
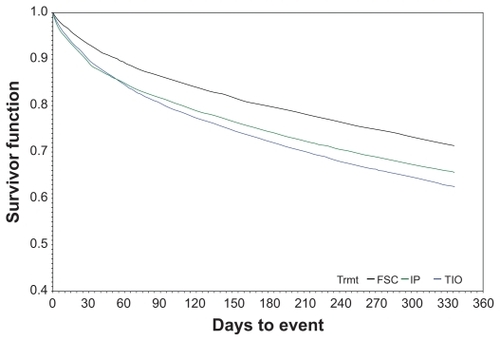
Table 3 Unadjusted COPD-related health care utilization and costs associated with initial maintenance therapies in the one-year follow-up period (“cost population”)
Table 4 Adjusted differences in COPD-related costs in the one-year follow-up period (“cost population”)Table Footnotea
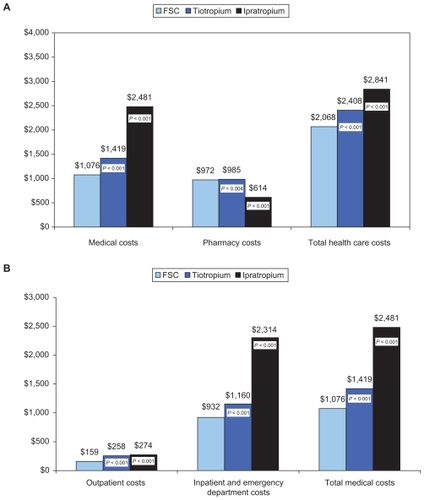
Figure 3 Predicted (adjusted) 12-month COPD-related health care costs (in 2009 $US) associated with different initial maintenance therapies (data from the “cost population”).a A) COPD-related health care costs; B) Breakdown of the medical component of COPD-related health care costs.
Abbreviations: COPD, chronic obstructive pulmonary disease; FSC, fluticasone propionate/salmeterol combination.