Figures & data
Figure 1 The flow chart of patient selection.
Abbreviation: CT, computed tomography.
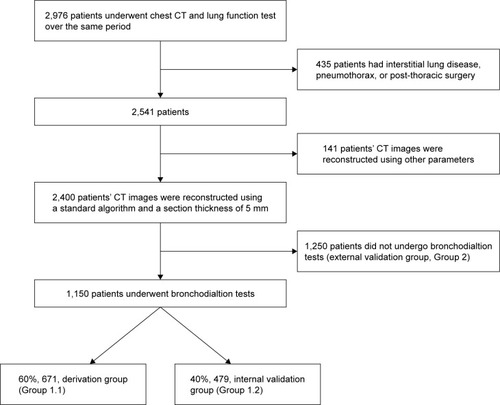
Table 1 Demographic features of the derivation, internal validation, and external validation groups
Figure 2 The emphysema extent of patients in Group 1 (including derivation group and internal validation group).
Notes: (A) LAA%; (B) Perc n.
Abbreviations: LAA%, percentage of the lung volume occupied by low attenuation areas; Perc n, percentile of the histogram of attenuation values.
Abbreviations: LAA%, percentage of the lung volume occupied by low attenuation areas; Perc n, percentile of the histogram of attenuation values.
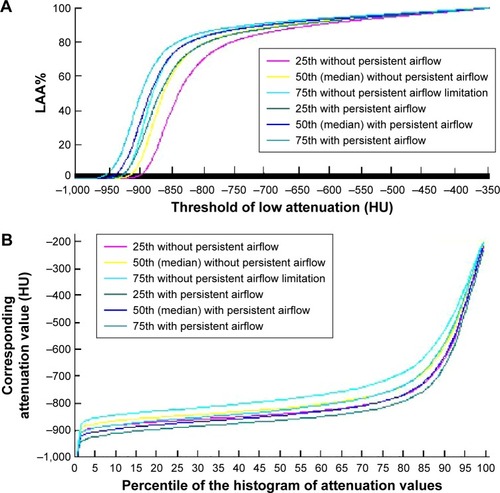
Figure 3 The correlation between post-bronchodilator FEV1/FVC and emphysema extent.
Notes: (A) LAA% using the threshold of −950 HU; (B) Perc 15 (HU).
Abbreviations: FEV1, forced expiratory volume in 1 second; FVC, forced vital capacity; LAA%, percentage of the lung volume occupied by low attenuation areas; Perc n, percentile of the histogram of attenuation values.
Abbreviations: FEV1, forced expiratory volume in 1 second; FVC, forced vital capacity; LAA%, percentage of the lung volume occupied by low attenuation areas; Perc n, percentile of the histogram of attenuation values.
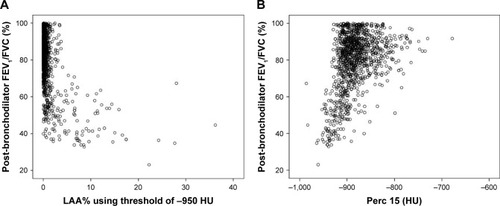
Figure 4 The AUCs of different emphysema indexes in diagnosing persistent airflow limitation.
Notes: (A) LAA% using different thresholds (HU); (B) Perc n.
Abbreviations: AUC, area under the ROC curve; LAA%, percentage of the lung volume occupied by low attenuation areas; Perc n, percentile of the histogram of attenuation values; ROC, receiver-operating characteristic.
Abbreviations: AUC, area under the ROC curve; LAA%, percentage of the lung volume occupied by low attenuation areas; Perc n, percentile of the histogram of attenuation values; ROC, receiver-operating characteristic.
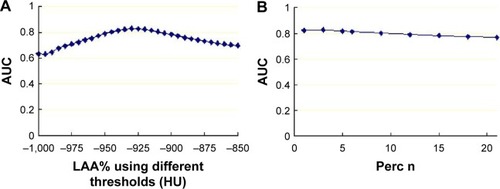
Table 2 Diagnostic values of the emphysema extent in diagnosing persistent airflow limitation using different cut point in groups 1–4
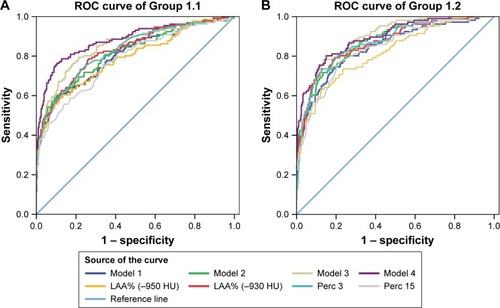
Figure 5 The ROC curve of emphysema indexes and predicting model in diagnosing consistent airflow limitation.
Notes: (A) Group 1.1 (derivation group); (B) Group 1.2 (internal validation group). LAA% (−950 HU) and LAA% (−930 HU) indicate the percentage of the lung volume occupied by low attenuation areas using the thresholds of −950 and −930 HU; Perc 3 and Perc 15 indicate percentile of the histogram of attenuation values.
Abbreviations: LAA%, percentage of the lung volume occupied by low attenuation areas; Perc n, percentile of the histogram of attenuation values; ROC, receiver-operating characteristic.
Abbreviations: LAA%, percentage of the lung volume occupied by low attenuation areas; Perc n, percentile of the histogram of attenuation values; ROC, receiver-operating characteristic.