
Figures & data
Table 1 Mean annual direct costs per patient per year by study group
Table 2 Summary of clinical outcomes by study group
Table 3 Incremental cost-effectiveness ratios by study group
Figure 1 Cost-utility scatter plots for DM vs UM.
Notes: Scatter plots show the results of nonparametric bootstrapping with each black circle representing incremental costs (EUR) and incremental effectiveness (QALYs) for DM vs UM. Deterministic outcomes are represented by a red circle.
Abbreviations: DM, disease management; EUR, Euros; QALY, quality-adjusted life year; UM, usual management.
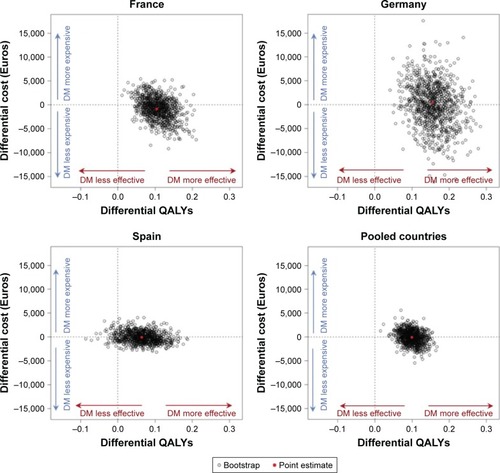
Figure 2 Cost-utility acceptability curves for DM vs UM.
Note: Willingness-to-pay threshold is expressed as cost per QALY gained for DM vs UM.
Abbreviations: DM, disease management; QALY, quality-adjusted life year; UM, usual management.
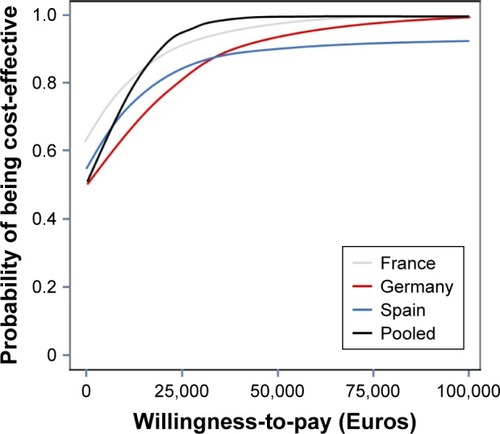
Figure 3 Cost per death avoided scatter plots for DM vs UM.
Notes: Scatter plots show the results of nonparametric bootstrapping with each black circle representing incremental costs (EUR) and number of deaths avoided for DM vs UM. Deterministic outcomes are represented by a red circle.
Abbreviations: DM, disease management; EUR, Euros; UM, usual management.
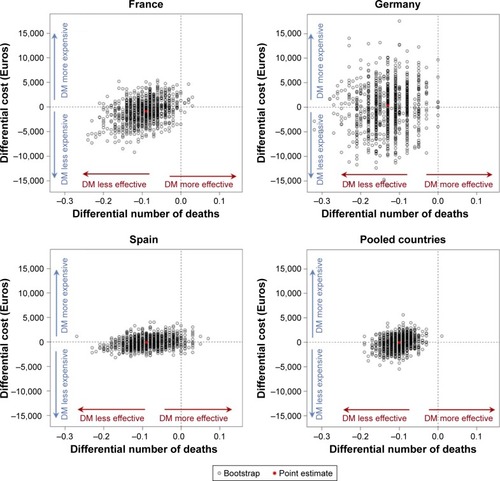
Figure 4 Cost per death avoided acceptability curves for DM vs UM.
Abbreviations: DM, disease management; UM, usual management.
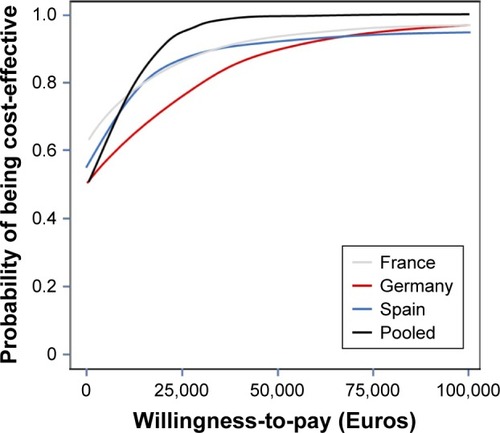
Table 4 Summary of nonparametric bootstrapping results by study group
Table S1 List of independent ethics committees or institutional review boards that approved COMET (NCT1241526)