
Figures & data
Figure 1 Patient disposition.
Abbreviations: AE, adverse event; BID, twice daily; FFIS, formoterol fumarate inhalation solution.
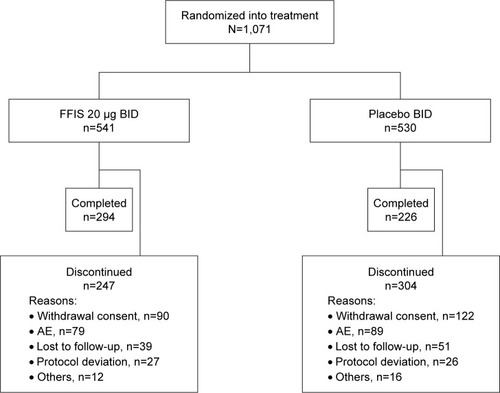
Figure 2 Kaplan–Meier plot of patients remaining in the study in both FFIS and placebo groups.
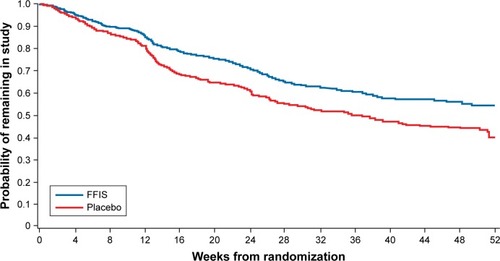
Table 1 Demographics and baseline clinical characteristics
Table 2 Incidence and cumulative probability of respiratory death, first COPD-related ER visit, and first COPD exacerbation-related hospitalization
Figure 3 Kaplan–Meier estimate of the cumulative probability of a primary end point event at week 52 (%).
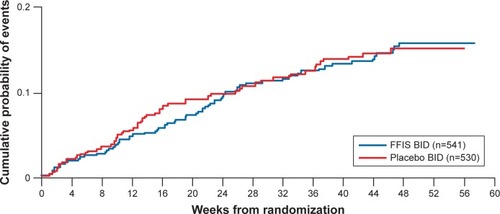
Table 3 Most frequently reported TEAEs (≥4% of patients in either treatment group by system organ class and preferred term)Table Footnotea
Table 4 Most frequently reported treatment-emergent SAEs (≥1% of patients in either treatment group by individual category by preferred term)Table Footnotea
Figure 4 Change from baseline in spirometry end points, FEV1 (A), FVC (B), and IC (C) following treatment with placebo or FFIS.
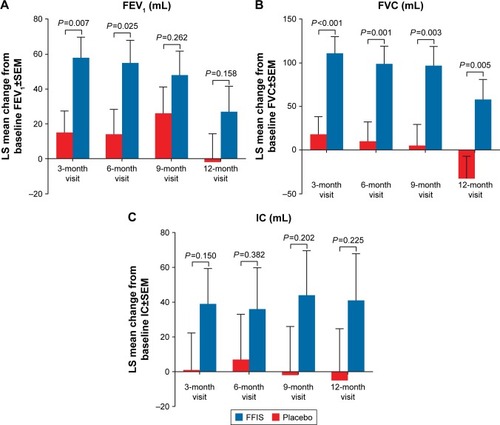
Table S1 Central IRB
Table S2 Local IRBs