Figures & data
Figure 1 Flow chart of the studied patients.
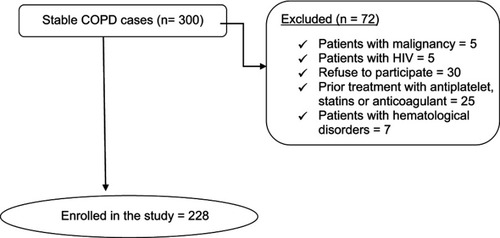
Table 1 Characteristics of the studied patients (n=228).
Figure 2 PH status in different COPD groups.
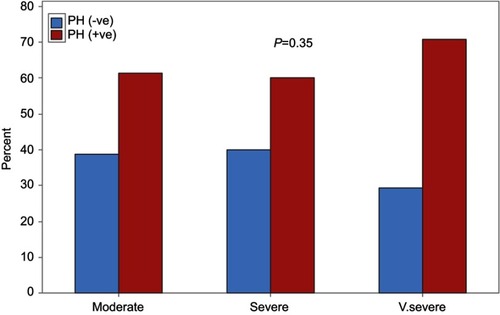
Figure 3 Severity degree of PH in different COPD groups.
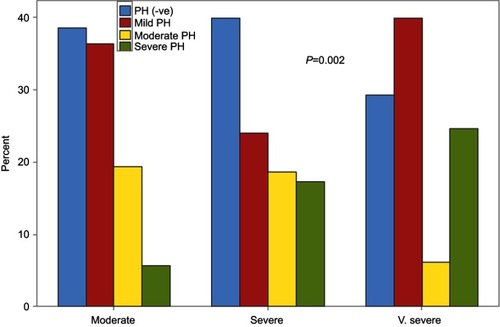
Table 2 PH and MPV in correlation with different COPD groups
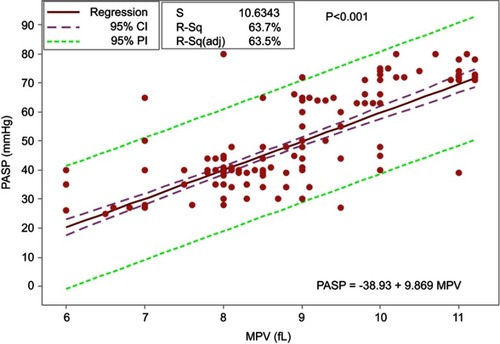
Figure 4 Correlation between MPV and PASP.
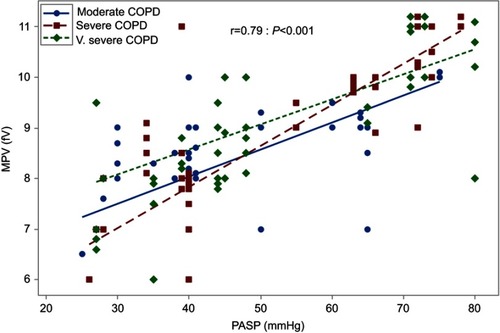
Table 3 MPV in patients with PH
Table 4 Predictors of PH in COPD patients using adjusted logistic regression models
Figure 5 ROC curve analysis of MPV. (A) In predicting PH. (B) In predicting severe PH.
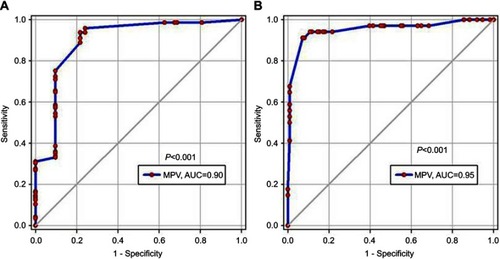
Figure 6 Correlation between exacerbation frequency and MPV.
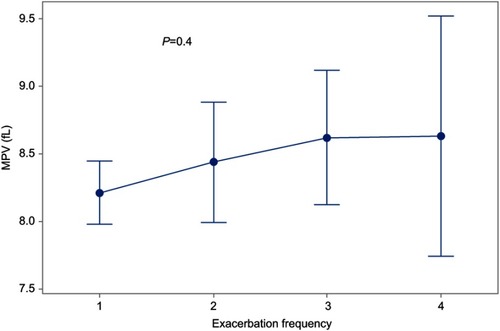
Figure 7 Correlation between exacerbation frequency and PASP.
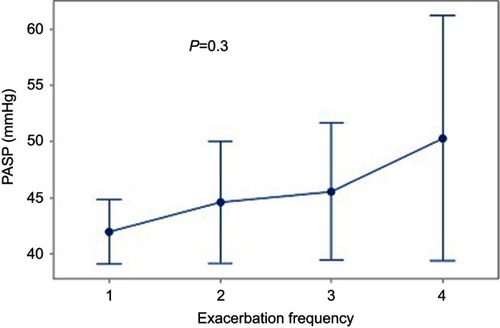
Figure 8 PASP prediction equation using MPV.