
Figures & data
Figure 1 Summary of the procedures used in this study.
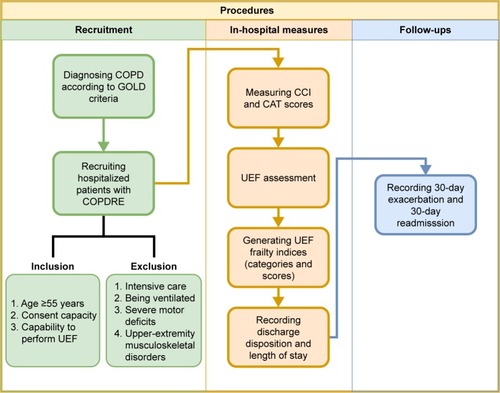
Figure 2 (A) UEF experimental set-up, (B) sensor outputs, and (C) UEF frailty score.
Abbreviation: UEF, upper-extremity function.
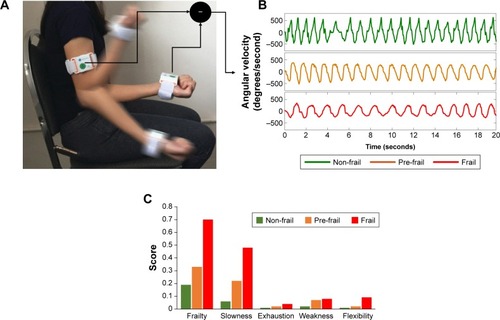
Table 1 Definitions of UEF parameters
Table 2 Sociodemographic information and health outcome measures
Figure 3 Potential of the frailty score and its components to risk-stratify COPD patients in terms of (A) unfavorable discharge disposition and (B) 30-day readmission.
Notes: All models were adjusted for age, BMI, and sex. *Significant difference (P≤0.05).
Abbreviations: BMI, body mass index; UEF, upper-extremity function.
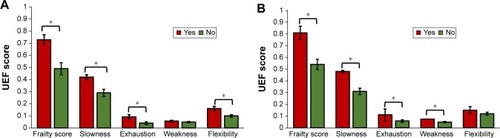
Figure 4 ROC curves of the logistic models predicting (A) unfavorable discharge disposition and (B) 30-day readmission.
Abbreviations: BMI, body mass index; ROC, receiver operating characteristic.
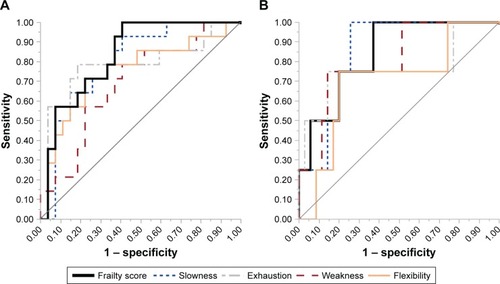
Table 3 Association between the frailty score and adverse health outcomes