Figures & data
Figure 1 CONSORT flowchart.
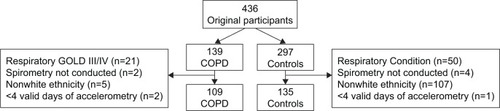
Table 1 Participant characteristics stratified by COPD status, reported as mean (SD) for continuous data
Table 2 PCA for sleep duration, VMCPM, sedentary time, light intensity PA, MVPA, and VPA (99.5% of variance explained for COPD and 99.6% of variance explained for controls, P<0.001)
Figure 2 Scatterplot of sedentary time against MVPA (minutes/day) for individuals with COPD, stratified by their ST (</≥600 minutes/day) and MVPA (</≥20 minutes/day).
Abbreviations: MVPA, moderate-to-vigorous PA; PA, physical activity; ST, stationary time.
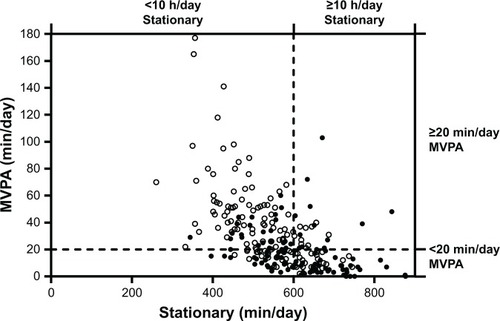
Figure 3 A schematic comparing the characteristics associated with sleep, low-intensity movement, and high-intensity movement for patients and controls.
Abbreviations: F, female; M, male.
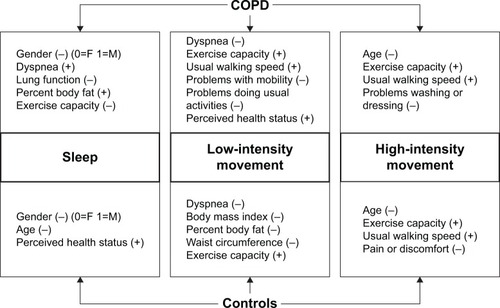
Table 3 Linear regression analyses exploring the associations of “low-intensity movement,” “high-intensity movement,” and “sleep” components with participant characteristics for COPD and control groups
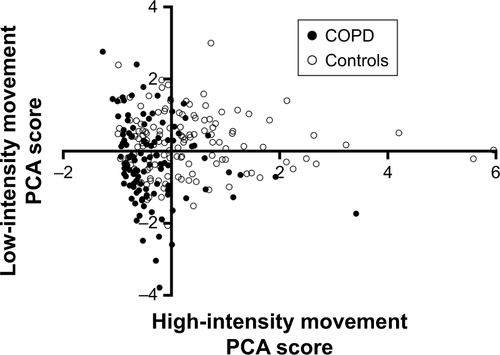
Figure S1 Scatterplot of component scores for “low-intensity movement” and “high-intensity movement.”
Notes: Solid circles: COPD; blank circles: controls.
Abbreviation: PCA, principal components analysis.