
Figures & data
Figure 1 Study design.
Note: POWER study design (groups switched to IND/GLY).
Abbreviations: bid, twice daily; h, hours; IND/GLY, indacaterol/glycopyrronium; od, once daily; SFC, salmeterol/fluticasone.
Abbreviations: bid, twice daily; h, hours; IND/GLY, indacaterol/glycopyrronium; od, once daily; SFC, salmeterol/fluticasone.
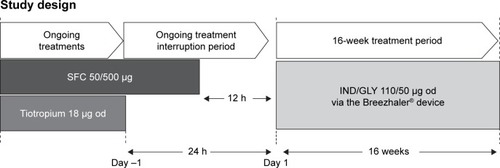
Figure 2 Patient disposition.
Note: Data are presented as n (%).
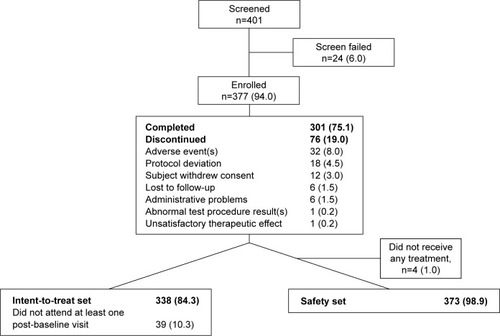
Table 1 Baseline demographics and clinical characteristics
Figure 3 Change from baseline in trough FEV1 at Week 16 (ITT population).
Notes: Data are presented as mean ± 95% CI. Δ, change from baseline.
Abbreviations: IND/GLY, indacaterol/glycopyrronium; ITT, intention-to-treat; SFC, salmeterol/fluticasone; Tio, tiotropium.
Abbreviations: IND/GLY, indacaterol/glycopyrronium; ITT, intention-to-treat; SFC, salmeterol/fluticasone; Tio, tiotropium.
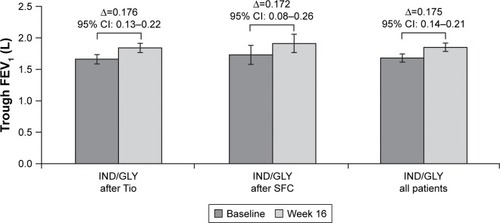
Figure 4 Change from baseline in trough FEV1 at Week 4 (ITT population).
Notes: Data are presented as mean ± 95% CI. Δ, change from baseline.
Abbreviations: IND/GLY, indacaterol/glycopyrronium; ITT, intention-to-treat; SFC, salmeterol/fluticasone; Tio, tiotropium.
Abbreviations: IND/GLY, indacaterol/glycopyrronium; ITT, intention-to-treat; SFC, salmeterol/fluticasone; Tio, tiotropium.
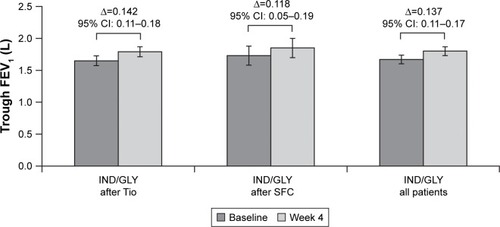
Figure 5 Change from baseline in TDI score at Week 16 (ITT population).
Notes: Data are presented as mean ± 95% CI. The dotted line represents MCID.
Abbreviations: IND/GLY, indacaterol/glycopyrronium; ITT, intention-to-treat; MCID, minimal clinically important difference; SFC, salmeterol/fluticasone; TDI, transition dyspnea index; Tio, tiotropium.
Abbreviations: IND/GLY, indacaterol/glycopyrronium; ITT, intention-to-treat; MCID, minimal clinically important difference; SFC, salmeterol/fluticasone; TDI, transition dyspnea index; Tio, tiotropium.
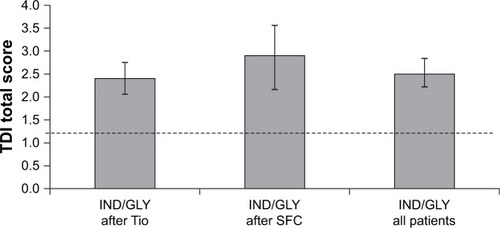
Figure 6 Change from baseline in CAT score at Week 16 (ITT population).
Note: Data are presented as mean ± 95% CI.
Abbreviations: CAT, COPD assessment test; IND/GLY, indacaterol/glycopyrronium; ITT, intention-to-treat; SFC, salmeterol/fluticasone; Tio, tiotropium.
Abbreviations: CAT, COPD assessment test; IND/GLY, indacaterol/glycopyrronium; ITT, intention-to-treat; SFC, salmeterol/fluticasone; Tio, tiotropium.
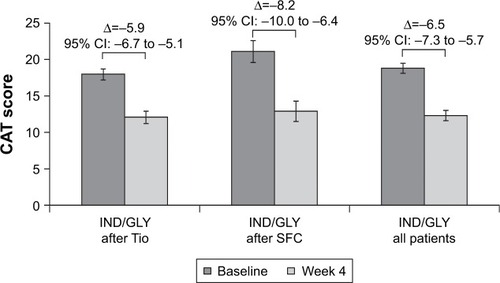
Figure 7 Change from baseline in trough FEV1 at Week 16 by subgroups.
Note: Data are presented as mean (95% CI).
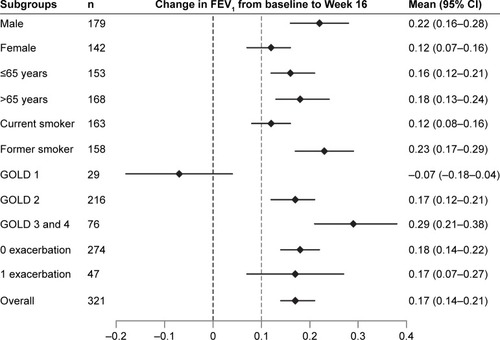
Table 2 Treatment-emergent AEs and SAEs during the study period (safety set)