
Figures & data
Table 1 Characteristics of the subjects with AECOPD or stable COPD
Table 2 Plasma NT-proBNP levels in subjects with AECOPD or stable COPD
Table 3 mPAPs in subjects with AECOPD or stable COPD
Figure 1 Pearson correlation analysis of relationship between plasma NT-proBNP levels and mPAPs in subjects with AECOPD (r=0.857, P<0.001).
Abbreviations: AECOPD, acute exacerbations of COPD; mPAP, mean pulmonary arterial pressure; NT-proBNP, N-terminal pro-brain natriuretic peptide.
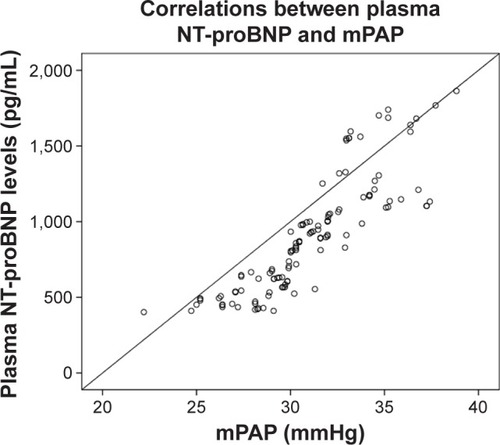
Table 4 Mean scores on the different domains of the 36-item short-form questionnaire in subjects with AECOPD and stable COPD