Figures & data
Table 1 Patients’ characteristics
Figure 1 Flowchart of patient enrollment process.
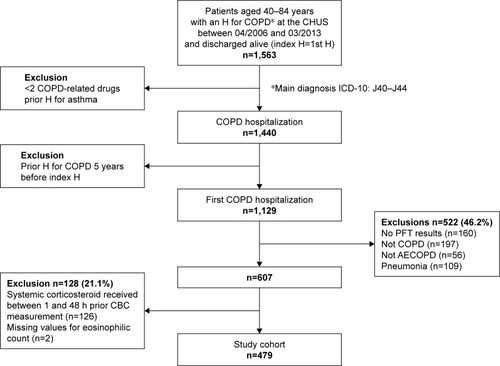
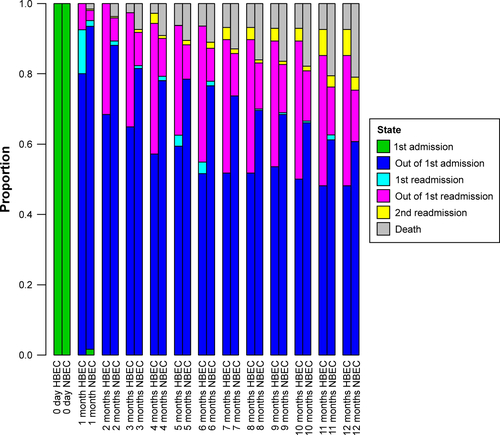
Figure 2 Observed snapshot percentages of patients in the six states, from day 0 to 12 months with an interval of 30 days. Snapshots are taken at each exact point in time.
Abbreviations: HBEC, high blood eosinophil count; NBEC, normal blood eosinophil count; WBC, white blood cell.
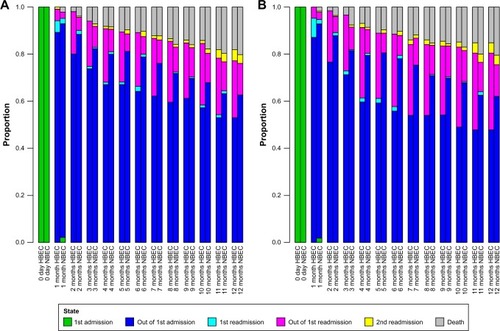
Figure 3 (A) Transition probability to the next states with 95% CIs for HBEC patients (defined as ≥200 cells/µL and/or ≥2% of the WBC count) and NBEC patients. (B) Transition probability to the next states with 95% CIs for HBEC patients (defined as ≥300 cells/µL and/or ≥3% of the WBC count) and NBEC patients. The transition probability from state 1 to state 2 is equal to 1.00 because we excluded patients who died during the first hospitalization. The transition probability from state 5 to state 6 is 1.00 because state 5 is the final state of alive patients in our model.
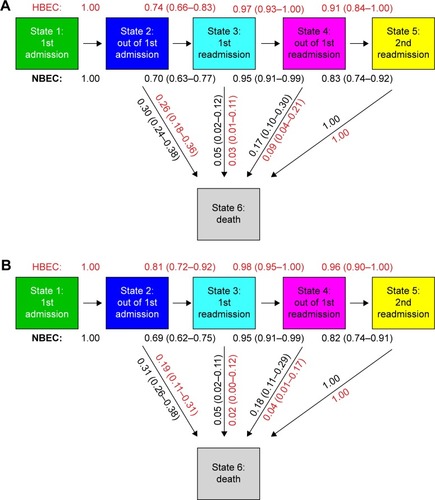
Figure S1 Observed snapshot percentages of patients in the six states, from day 0 to 12 months with an interval of 30 days. Snapshots are taken at each exact point in time. HBEC patients (defined as ≥400 cells/µL and/or ≥4% of the WBC count) are compared to NBEC patients.
Abbreviations: HBEC, high blood eosinophil count; NBEC, normal blood eosinophil count; WBC, white blood cell.