
Figures & data
Figure 1 Flow chart for subject screening in the derivation group (A) and external validation group (B).
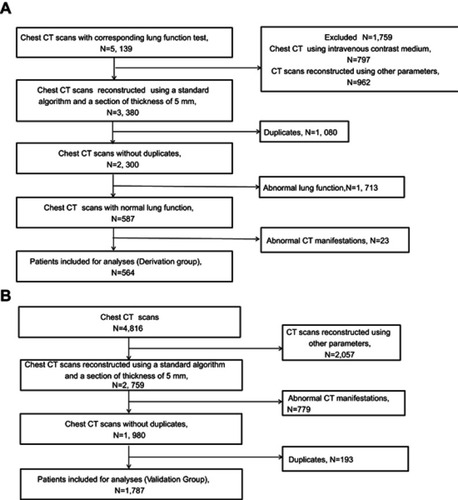
Table 1 Demographic characteristics of participants in the derivation and external validation groups
Table 2 Description of lung attenuation distribution and lung volume from computed tomography (CT) in the derivation and external validation groups
Figure 2 Distributions of LAA% and Perc n in subjects with normal lung function in males and females.
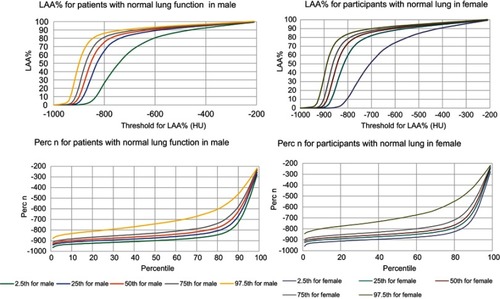
Table 3 Reference equations and normal ranges for lung attenuation distribution and lung volume from computed tomography (CT) scans based on data from the derivation group
Table 4 Lung volume and attenuation distribution from different scanners and reconstruction kernels
Table 5 Comparison between observed value of derivation group and the predicted value from different reference equations for lung volume and extent of emphysema
Figure 3 Consistency and difference between computed tomography (CT) lung volume vs single-breath (SB) lung volume. (A) Scatter plot between lung volume measured on CT and lung volume measured by SB gas dilution method (total lung capacity [TLC]-SB). (B) Scatter plot between lung volume (CT) - TLC (SB) and TLC (SB). (C) Scatter plot between lung volume (CT) - TLC (SB) and vital capacity on spirometry. (D) Scatter plot between lung volume (CT) - TLC (SB) and age. (E) Scatter plot between lung volume (CT) - TLC (SB) and height. (F) Scatter plot between lung volume (CT) - TLC (SB) and weight.
![Figure 3 Consistency and difference between computed tomography (CT) lung volume vs single-breath (SB) lung volume. (A) Scatter plot between lung volume measured on CT and lung volume measured by SB gas dilution method (total lung capacity [TLC]-SB). (B) Scatter plot between lung volume (CT) - TLC (SB) and TLC (SB). (C) Scatter plot between lung volume (CT) - TLC (SB) and vital capacity on spirometry. (D) Scatter plot between lung volume (CT) - TLC (SB) and age. (E) Scatter plot between lung volume (CT) - TLC (SB) and height. (F) Scatter plot between lung volume (CT) - TLC (SB) and weight.](/cms/asset/6f32da7c-e59d-4c22-ba21-f9dd045fd66b/dcop_a_187596_f0003_c.jpg)