
Figures & data
Table 1 Demographic and clinical characteristics of subjects
Table 2 Paired-samples test results
Figure 1 Bland–Altman plots of soluble protein markers in sputum supernatant. Bland–Altman plots of (A) IL1β; (B) IL5; (C) IL6; (D) IL8; (E) IL10; (F) IL13; (G) IL33; (H) sRAGE; (I) TNFα; and (J) VEGF.
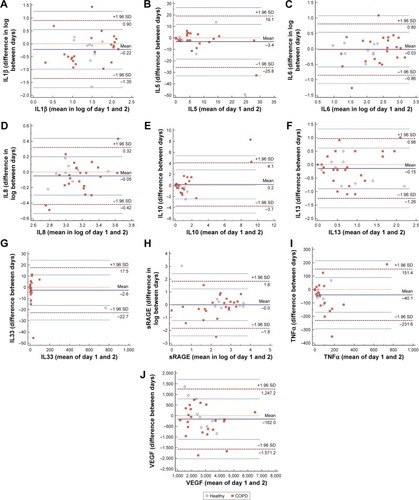
Table 3 Intraclass correlation coefficient (ICC) assessment results
Figure 2 Bland–Altman plots of IgG autoantibodies in sputum supernatant. Bland–Altman plots of (A) anti-aggrecan IgG; (B) anti-amyloid IgG; (C) anti-CENP-B IgG; (D) anti-collagen I IgG; (E) anti-collagen II IgG; (F) anti-collagen IV IgG; (G) anti-cytochrome C IgG; (H) anti-cytokeratin 18 IgG; (I) anti-elastin IgG; (J) anti-HSP47 IgG; (K) anti-HSP70 IgG; (L) anti-SS-B IgG; and (M) anti-vimentin IgG.
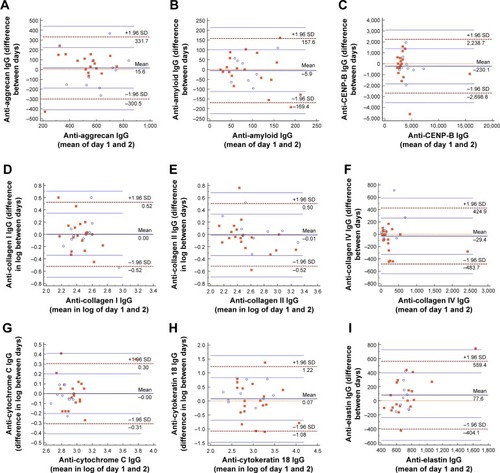
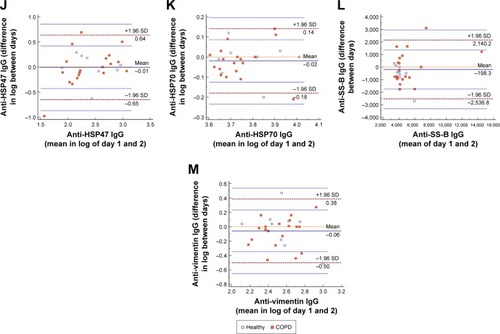
Figure 3 Bland–Altman plots of IgM autoantibodies in sputum supernatant. Bland–Altman plots of (A) anti-aggrecan IgM; (B) anti-amyloid IgM; (C) anti-CENP-B IgM; (D) anti-collagen I IgM; (E) anti-collagen II IgM; (F) anti-collagen IV IgM; (G) anti-cytochrome C IgM; (H) anti-cytokeratin 18 IgM; (I) anti-elastin IgM; (J) anti-HSP47 IgM; (K) anti-HSP70 IgM; (L) anti-SS-B IgM; and (M) anti-vimentin IgM.
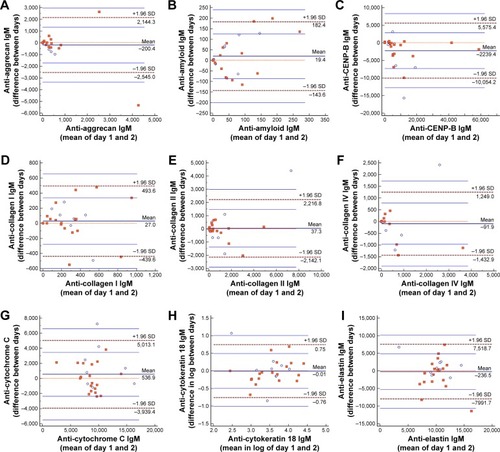
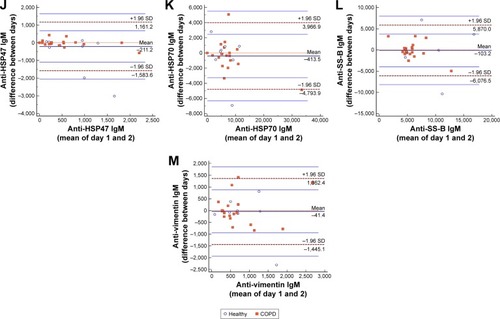
Figure 4 Bland–Altman plots of sputum cell counts. Bland–Altman plots of (A) sputum neutrophils; (B) sputum macrophages; (C) sputum eosinophils; and (D) sputum lymphocytes.
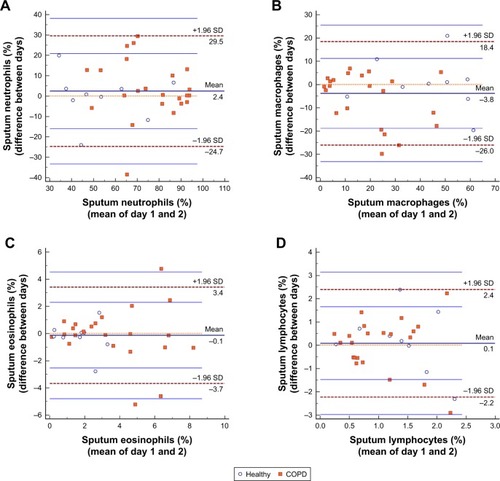
Figure S1 Scatter plots of soluble protein markers with pair-wise comparisons of the two measurements. Scatter plots of (A) IL1β; (B) IL5; (C) IL6; (D) IL8; (E) IL10; (F) IL13; (G) IL33; (H) sRAGE; (I) TNFα; and (J) VEGF.
Abbreviations: IL, interleukin; sRAGE, soluble receptor for advanced glycation end-products; TNFα, tumor necrosis factor-α; VEGF, vascular endothelial growth factor.
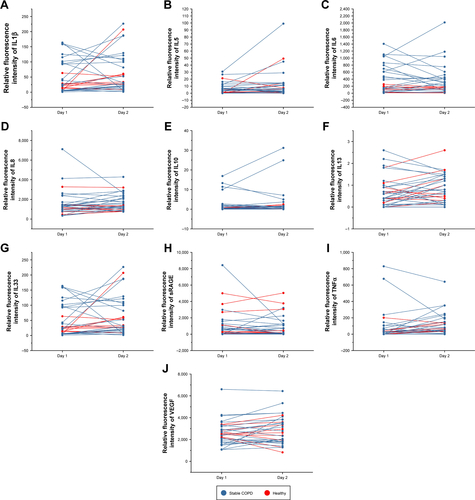
Figure S2 Scatter plots of IgG autoantibodies with pair-wise comparisons of the two measurements. Scatter plots of (A) anti-aggrecan IgG; (B) anti-amyloid IgG; (C) anti-CENP-B IgG; (D) anti-collagen I IgG; (E) anti-collagen II IgG; (F) anti-collagen IV IgG; (G) anti-cytochrome C IgG; (H) anti-cytokeratin 18 IgG; (I) anti-elastin IgG; (J) anti-HSP47 IgG; (K) anti-HSP70 IgG; (L) anti-SS-B IgG; and (M) anti-vimentin IgG.
Abbreviations: CENP-B, centromere protein B; HSP47, heat shock protein 47; HSP70, heat shock protein 70; SS-B, La/Sjögren syndrome type B antigen.
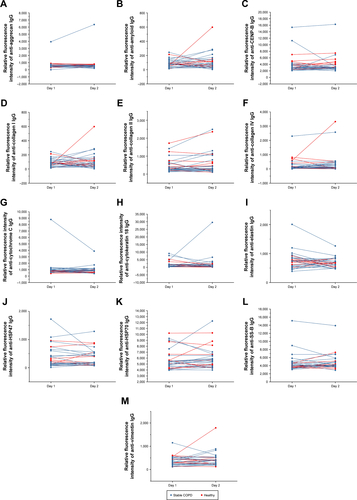
Figure S3 Scatter plots of IgM autoantibodies with pair-wise comparisons of the two measurements. Scatter plots of (A) anti-aggrecan IgM; (B) anti-amyloid IgM; (C) anti-CENP-B IgM; (D) anti-collagen I IgM; (E) anti-collagen II IgM; (F) anti-collagen IV IgM; (G) anti-cytochrome C IgM; (H) anti-cytokeratin 18 IgM; (I) anti-elastin IgM; (J) anti-HSP47 IgM; (K) anti-HSP70 IgM; (L) anti-SS-B IgM; (M) anti-vimentin IgM.
Abbreviations: CENP-B, centromere protein B; HSP47, heat shock protein 47; HSP70, heat shock protein 70; SS-B, La/Sjögren syndrome type B antigen.
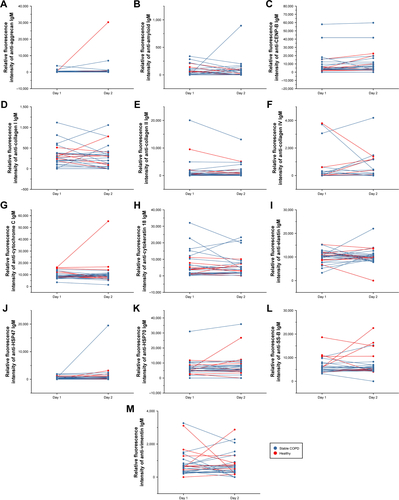
Figure S4 Scatter plots of sputum cell counts with pair-wise comparisons of the two measurements. Scatter plots of (A) sputum neutrophils; (B) sputum macrophages; (C) sputum eosinophils; and (D) scatter plots of sputum lymphocytes.
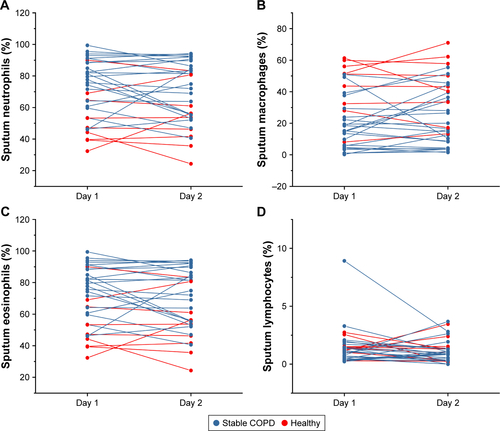
Table S1 All measurement results
Table S2 Comparison of measurements between groups