Figures & data
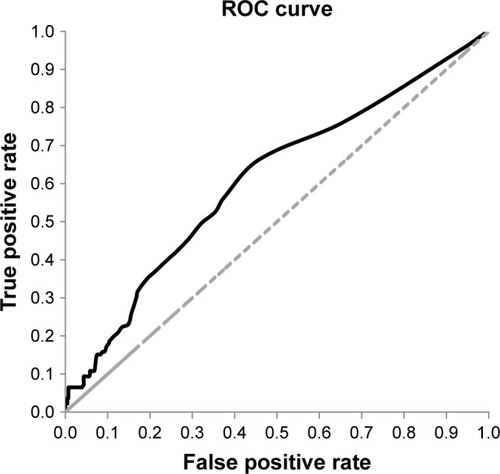
Figure 1 Attrition diagram.
Abbreviations: FL, Florida; TN, Tennessee.
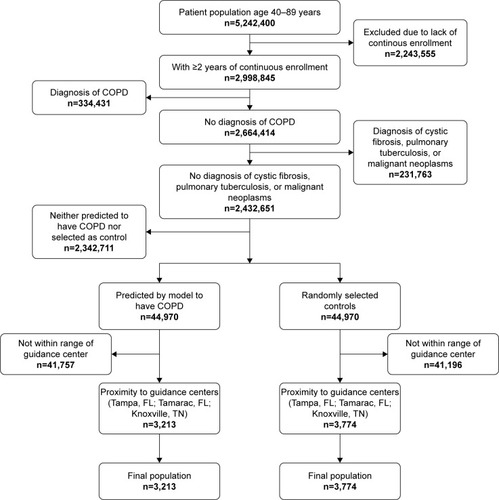
Table 1 Parameter estimates for the COPD predictive model
Table 2 Number of subjects who were recruited and who attended spirometry evaluation
Table 3 Baseline demographic characteristics of study population
Table 4 Baseline clinical characteristics of study population
Table 5 Spirometry evaluation of study population
Figure 2 ROC curve.
Abbreviations: AUC, area under the curve; ROC, receiver operator characteristics.