Figures & data
Figure 1 Comprehensive sputum slide quality score.
Notes: Representative examples of sputum cell preparations were rated on the 5-point scale. Original magnification, left column: ×200; right column: ×1,000. White arrows mark cellular debris; black arrows mark cellular integrity. Quality 2.0 – morphological quality of the cells: very good, differentiation of all cells possible, and no squamous epithelial cells present. Quality 1.5 – morphological quality of the cells: good, differentiation of most cells possible, and few squamous epithelial cells present. Quality 1.0 – morphological quality of the cells: satisfactory, differentiation of many cells possible, and squamous epithelial cells present but with little or no effect on inflammatory cell identification. Quality 0.5 – morphological quality of the cells: borderline, differentiation of cells possible, high fraction of nonidentifiable cells, and many squamous epithelial cells present, which partially affect inflammatory cell identification. Quality 0.0: cell detritus, less than 400 identifiable cells, or >50% squamous epithelial cells present that clearly interfere with or prevent inflammatory cell identification.
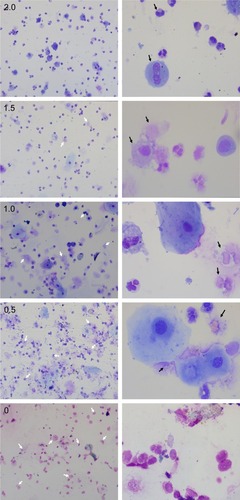
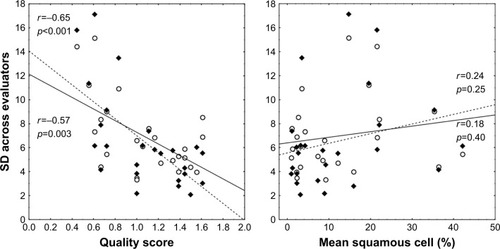
Figure 2 Correlation between quality score (low to high, 0–2) and inter-evaluator variability (SD) for cell percentages across nine evaluators (left), and correlation between the mean level of squamous cells (%) and SD (right).
Note: open circles, alveolar macrophages (AMs); closed diamonds, neutrophil granulocytes (NGs); closed lines, linear fit for AMs; dashed lines, linear fit for neutrophils; r, correlation coefficient.