
Figures & data
Table 1 Clinical and lung function data
Figure 1 Distribution of the 6MWD (m).
Abbreviations: 6MWD, 6-min walking distance; m, meters.
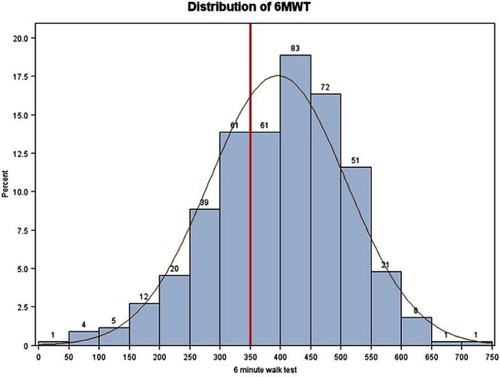
Figure 2 Relationship between 6MWD and EID (SpO2 min).
Abbreviations: 6MWD, 6-min walking distance; EID, exercise induced desaturation.
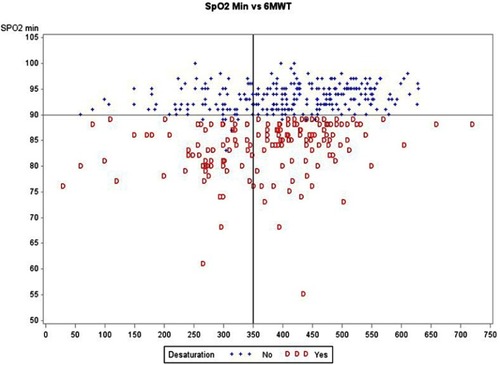
Table 2 Univariate comparisons for low vs high 6MWD
Table 3 (A) Multivariate analysis for low vs high 6MWD. (B) Multivariate analysis for the presence of desaturations
Table 4 Multivariate analysis for 6MWD in absolute value (m)
Table S1 Univariate logistic analysis for low 6MWD
Table S2 Univariate logistic analysis for the presence of significant desaturations