Figures & data
Table 1 Primers used for reverse transcription quantitative PCR
Table 2 General characteristics of the study participants
Table 3 Correlations between expressions of acute phase reactant
Figure 1 Gene expression in COPD patients and control group. Gene expression of acute phase reactants in resistant smokers (controls) and COPD patients in lung parenchyma (panel A). SAA4 expression profile in the lung parenchyma according to COPD stage (Panel B). I, GOLD I COPD; II, GOLD II COPD; III, GOLD III COPD. No statistically significant differences were identified (P>0.05).
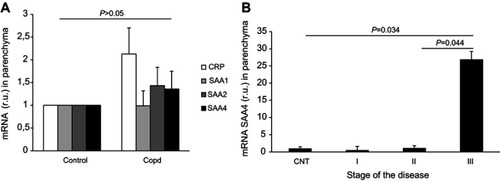
Figure 2 Gene expression in COPD patients and control group. Gene expression of acute phase reactants in resistant smokers (controls) and COPD patients in pulmonary artery (panel A). SAA2 expression profile in the pulmonary artery according to COPD stage (B). I, GOLD I COPD; II, GOLD II COPD; III, GOLD III COPD. No statistically significant differences were identified (P>0.05).
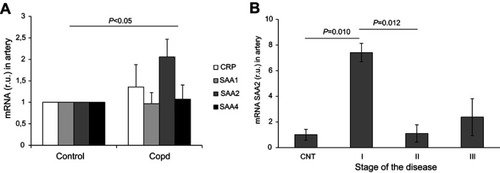
Figure 3 Gene expression of acute phase reactants in resistant smokers (controls) and COPD patients in blood cells (A). SAA1 (Panel B) and SAA4 (Panel C) expression in blood cells according to COPD stage. I, GOLD I COPD; II, GOLD II COPD; III, GOLD III COPD. No statistically significant differences were identified (P>0.05).
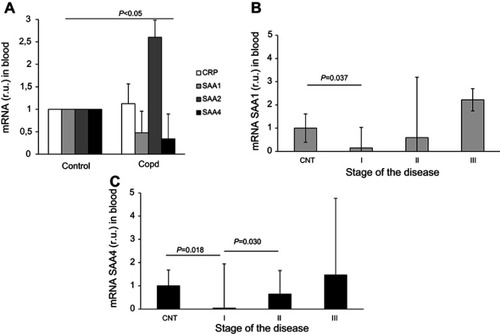
Figure 4 Comparison of acute phase reactants gene expression levels in different tissues (blood cells, pulmonary artery, and lung parenchyma) of COPD patients. Panel (A): CRP expression; panel (B): SAA2 expression; panel (C): SAA1 expression and panel (D): SAA4 expression.
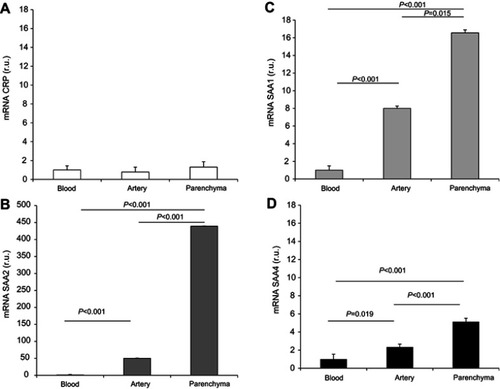
Table 4 Correlations between different tissues
Figure 5 Plasma concentrations of serum amyloid A (SAA) (panel A) and CRP (panel B) in CNTs and patients with different stages of COPD.
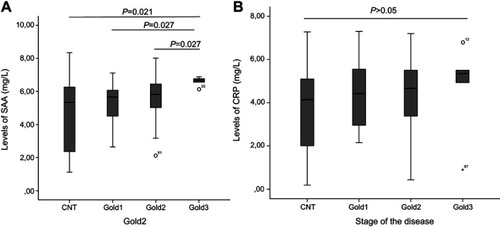
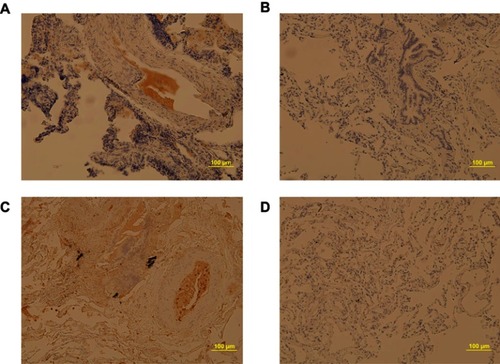
Figure 6 Immunostaining of C-reactive protein (CRP) and serum amyloid A (SAA) in lung biopsies of patients. Pulmonary parenchyma stained with CRP of a COPD (panel A) and control (panel B). Pulmonary parenchyma stained with SAA of COPD patient (panel C) and control patients (panel D). Scale bar represents 100 μm in each case.