
Figures & data
Figure 1 Study design.
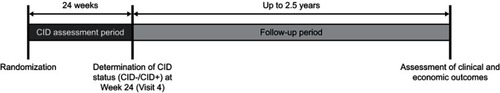
Table 1 Baseline demographics and characteristics
Figure 2 Patient disposition.
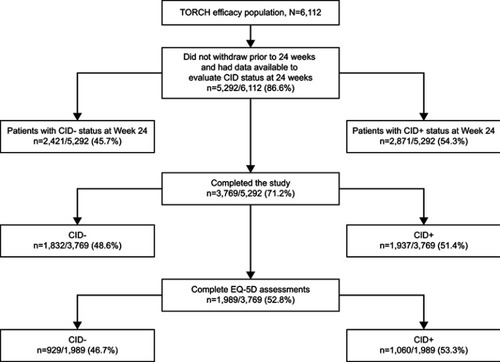
Table 2 Healthcare resource utilization by CID status and by treatment
Figure 3 Total direct costs PPPY* (2016 GBP)† by CID status, for all treatments (A) and by individual treatment (B). *Cost data are presented to three significant figures for values of four figures or more and to the nearest pound for values of three figures or less; †adjusted using a two-part modeling approach, where a logistic regression was run to predict the likelihood of having costs >0, followed by a generalized linear model (gamma distribution with a log link) run for patients with positive costs. The results of these two models were then used to calculate predicted cost estimates for each patient. 95% CIs were generated using 5,000 bootstrapped samples (sampling with replacement). Analysis of complete cases was weighted by the inverse probability of being a complete case.
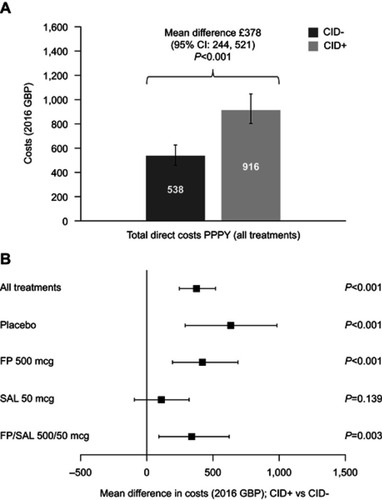
Figure 4 EQ-5D score by time and CID status at Week 24 and 3 years. *EQ-5D was administered in only a subset of countries participating in the TORCH study.
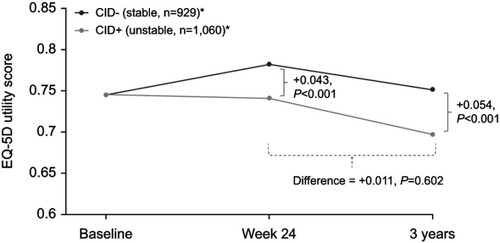
Table 3 EQ-5D utility changes by CID status and by treatment
Table S1 Direct medical costs included in the CID analysis
Table S2 EQ-5D utility changes and health resource utilization by CID status
Data availability
The corresponding author had full access to all data. Anonymized individual participant data and study documents can be requested for further research from www.clinicalstudydatarequest.com.