Figures & data
Table 1 Baseline characteristics of study participants
Table 2 Lung volume measurement
Figure 1 Study population.
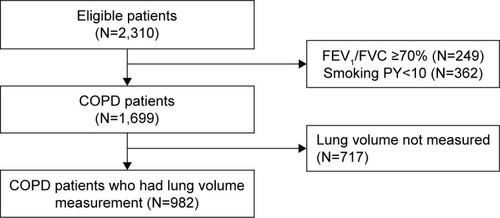
Figure 2 Correlation between IC, IC/TLC and (A, E) mMRC dyspnea scale, (B, F) SGRQ, (C, G) CAT, and (D, H) 6MWD in COPD patients.
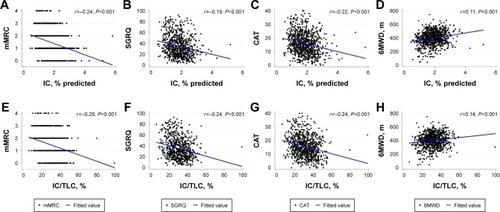
Figure 3 Mean change of FEV1 and IC from enrollment.
Abbreviations: BD, bronchodilator; IC, inspiratory capacity.
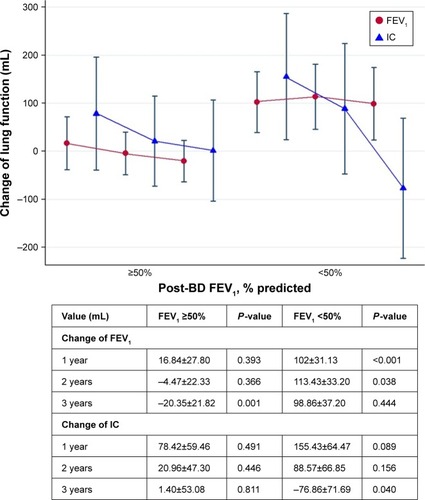
Table 3 Effect of exacerbation on the change in FEV1, IC, and IC/TLC ratio
Table 4 Exacerbation risk during the follow-up period of 3 years according to FEV1 and IC changesTable Footnotea and IC/TLC ratioTable Footnoteb
Figure S1 Correlation between (A) IC and (B) IC/TLC ratio with post-bronchodilator FEV1.
Abbreviations: BD, bronchodilator; IC, inspiratory capacity; TLC, total lung capacity.
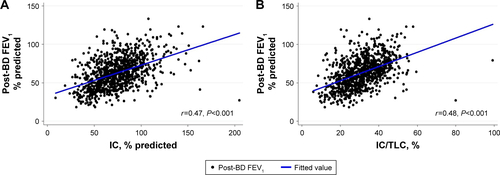
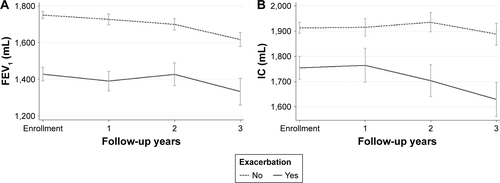
Figure S2 Longitudinal change of annual (A) FEV1 and (B) IC (mL) in COPD patients during 3-year follow-up according to history of exacerbation.
Abbreviation: IC, inspiratory capacity.