
Figures & data
Table 1 Clinical characteristics of subgroups by non-COPD and COPD among never smoker NSCLC (n=345)
Figure 1 Flowchart of the patients enrolled in the study.
Abbreviations: COPD, chronic obstructive pulmonary disease; NSCLC, non-small cell lung cancer; PFT, pulmonary function test.
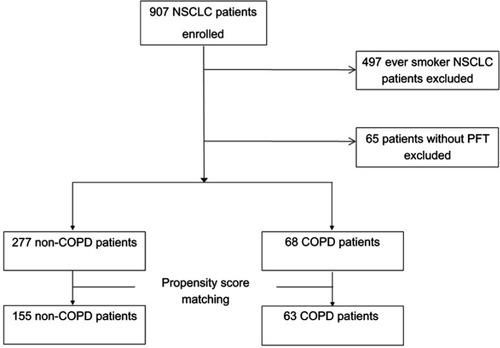
Table 2 Risk factors for nonsmoker COPD among NSCLC patients (univariate and multivariate analysis)
Table 3 Comparison of clinical characteristics between the non-COPD and COPD groups in never smoker NSCLC after propensity score matching
Figure 2 Comparison of overall survival between the COPD and non-COPD group in the never-smoker non-small cell lung cancer patients after propensity score matching.
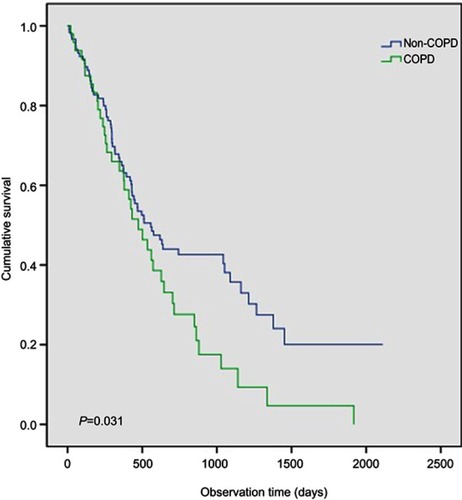
Table 4 Variables analyses for mortality in the 218 patients with NSCLC after propensity score matching