
Figures & data
Figure 1 Schematic representation of the study.
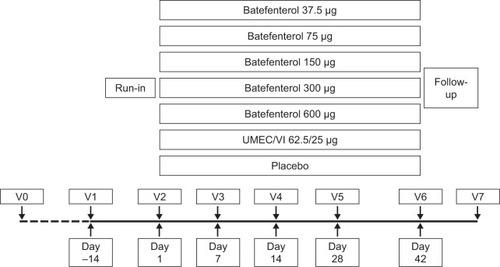
Figure 2 CONSORT diagram.
Abbreviations: ECG, electrocardiogram; UMEC/VI, umeclidium/vilanterol.
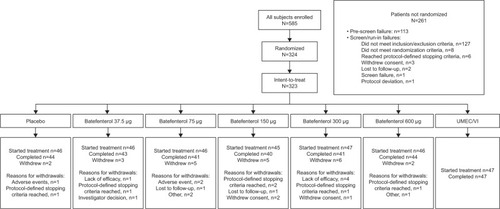
Table 1 Baseline demographics and disease characteristics (ITT population)
Table 2 Change from baseline at day 42 in WM FEV1 (primary endpoint) and 24-hour trough FEV1 (secondary endpoint) (ITT population)
Figure 3 Bayesian Emax model of the change from baseline in the WM FEV1 over 0–6 hours post-dose on day 42 (primary endpoint, ITT population).
Abbreviations: ITT, intent-to-treat; UMEC/VI, umeclidinium/vilanterol; WM, weighted mean.
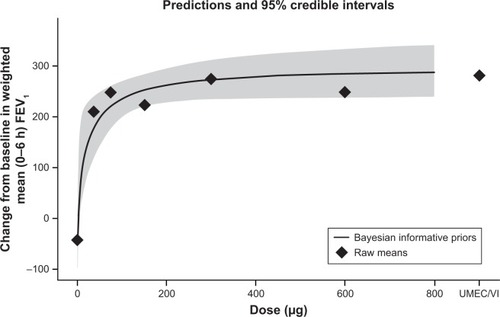
Figure 4 Posterior distribution plots for pairwise differences in the change from baseline in the WM FEV1 over 0–6 hours post-dose on day 42 (A) vs placebo and (B) vs UMEC/VI (ITT population).
Abbreviations: ITT, intent-to-treat; UMEC/VI, umeclidium/vilanterol; WM, weighted mean.
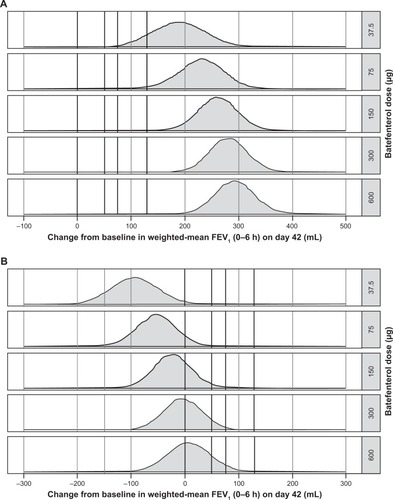
Figure 5 MMRM analysis of the change from baseline in the WM FEV1 over 0–6 hours post-dose on day 42 (ITT population).
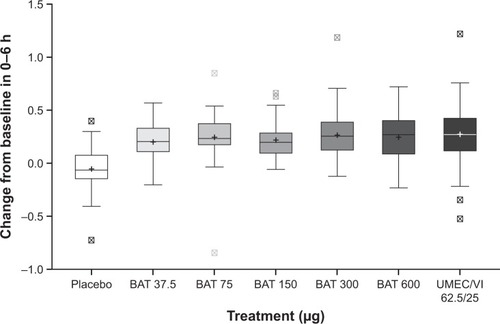
Table 3 Summary of on-treatment AEs that were reported in >1 patient in any treatment group (ITT population)
Figure S1 Liver chemistry withdrawal or stopping criteria.
Note: *INR value is not applicable to subjects on anticoagulants.
Abbreviations: INR, international normalized ratio; ULN, upper limit of normal; ALT, alanine aminotransferase.
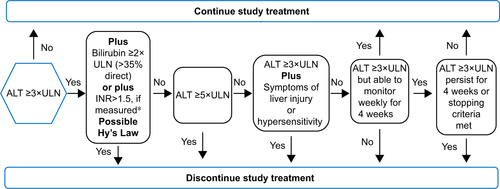
Table S1 Institutional review boards
Table S2 Excluded medications prior to visit 1 and throughout the study
Data availability
Anonymized individual participant data and study documents can be requested for further research from www.clinicalstudydatarequest.com.