Figures & data
Table 1 Demographic and clinical characteristics of COPD patients and NCs
Table 2 Two-sample t-test differences between COPD patients and NCs using ReHo method (GRF-corrected, voxel-level P <0.01, and cluster level of P <0.05)
Figure 1 The differences map in ReHo between COPD patients and NC groups (two-tailed GRF correction, voxel-level P <0.01, and cluster-level P <0.05) is shown in axial position. The blue areas indicate lower ReHo values.
Abbreviations: GRF, Gaussian random field theory; NC, normal control; ReHo, regional homogeneity.
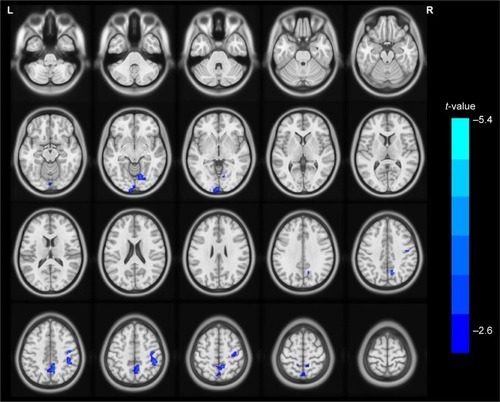
Figure 2 Significant abnormal activity map observed in the left occipital lobe, the right lingual, the bilateral precuneus, and the right precentral gyrus between patients with COPD and NCs (two-tailed, GRF correction, voxel-level P <0.01, and cluster-level P <0.05) in three-dimensional image.
Abbreviations: GRF, Gaussian random field theory; NCs, normal controls.
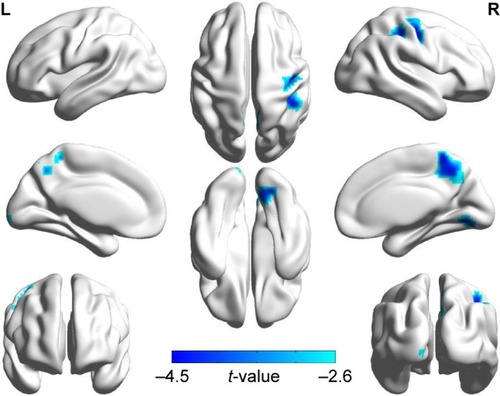
Figure 3 Mean ReHo signal values for altered regional brain areas between COPD patients and NCs.
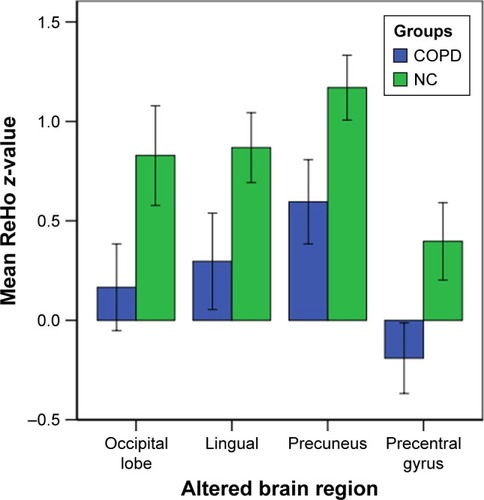
Figure 4 ROC curve analysis of the mean ReHo values for abnormal activity brain regions.
Abbreviations: AUC, area under the curve; ReHo, regional homogeneity; ROC, receiver operating characteristic.
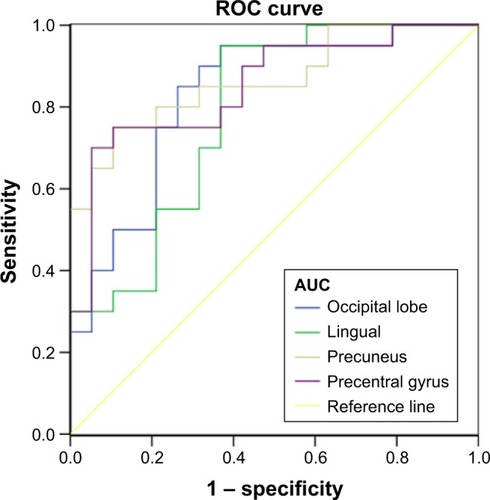
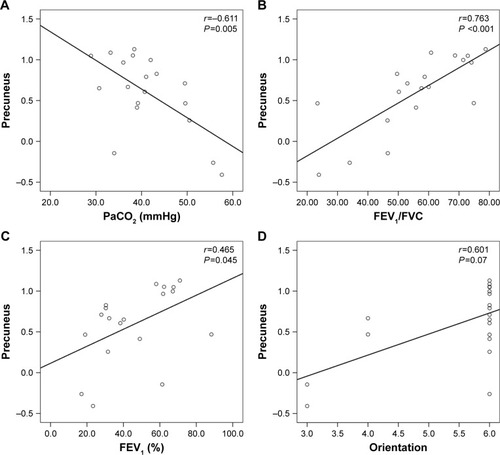
Figure 5 There was a significant correlation between the ReHo values in the precuneus and the clinical parameters (PaCO2, FEV1/FVC, FEV1%, orientation) in the stable COPD patients.