Figures & data
Table 1 Characteristics of subjects providing peripheral blood
Table 2 Primers of the candidate differentially expressed lncRNAs
Figure 1 Differentially expressed lncRNAs in CD4+ T cells of the AECOPD group, stable COPD group, and control group.
Abbreviations: LncRNA, long noncoding RNA; AECOPD, acute exacerbation of COPD.
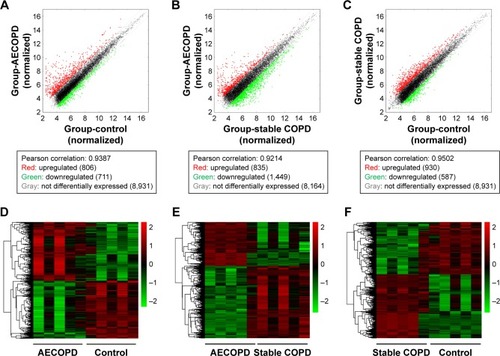
Figure 2 (A) Venn graph showed the overlap of differentially expressed lncRNAs between different groups. Yellow: upregulated lncRNAs in AECOPD vs control; purple: upregulated lncRNAs in AECOPD vs stable COPD; green: upregulated lncRNAs in stable COPD vs control; red: downregulated lncRNAs in stable COPD vs control. (B) Validation of the selected lncRNAs in CD4+ T cells in the AECOPD group compared with the stable COPD group and control by qRT-PCR. The relative expression levels of NR-026690 and ENST0000447867 are shown. **P<0.01, ***P<0.001. (C) ROC curve of lncRNAs. The diagnostic values of NR-026690 and ENST0000447867 are shown.
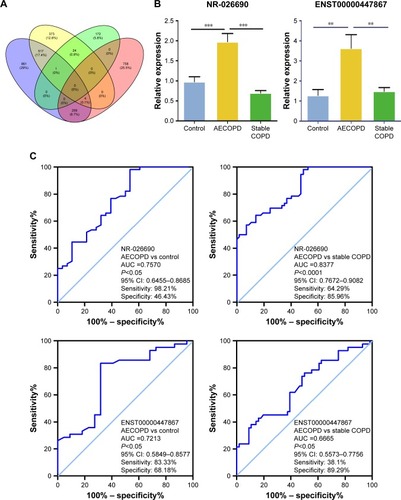
Figure 3 (A) LncRNA-mRNA co-expression network. Green: lncRNA; red: mRNA; solid line: positive correlation; dotted line: negative correlation. (B) Venn graph showed the overlap of co-expressed mRNAs of NR-026690 and ENST0000447867.
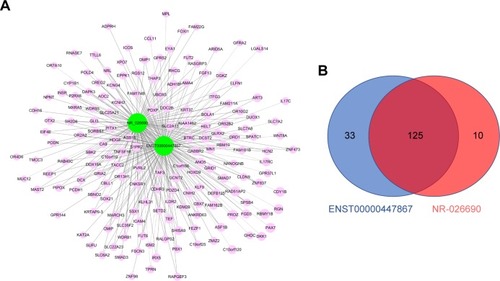
Figure 4 GO (A) and KEGG pathway analyses (B) of the overlapping part of co-expressed mRNAs of NR-026690 and ENST0000447867. The top ten items are listed. Note: The omitted text in A can be searched by the reader according to the GO number on the website http://wego.genomics.org.cn/tools.
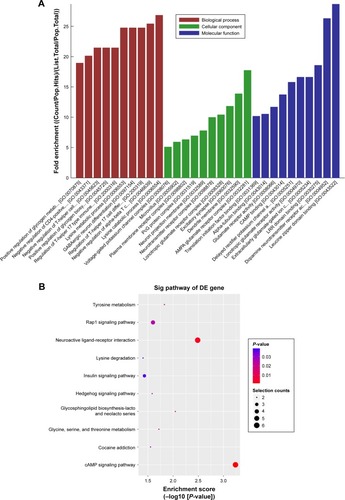
Figure 5 (A) Venn graph shows the overlap of co-expressed mRNAs and target mRNAs predicted by ceRNA analysis. Purple: target mRNAs of NR-026690 predicted by ceRNA analysis; yellow: co-expressed mRNAs of NR-026690; green: target mRNAs of ENST0000447867 predicted by ceRNA analysis; red: co-expressed mRNAs of ENST0000447867. (B) lncRNA-microRNA-mRNA network. Blue: lncRNA; green: microRNA; red: mRNA; blue line: relationship between lncRNA and microRNA; green line: relationship between microRNA and mRNA.
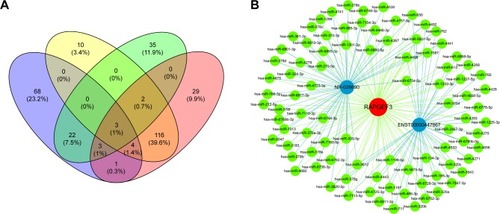
Table 3 Spearman’s rank correlation test of cytokines and qRT-PCR-confirmed lncRNAs in CD4+ T cells from the AECOPD patients
Figure 6 (A) The transcript level of RAPGEF3 in CD4+ T cells of the different groups was determined by qRT-PCR. The transcript level was expressed as ln transformed and relative to the mean of the control group. *P<0.05, **P<0.01. (B) Correlation between NR-026690 and RAPGEF3 transcript levels in CD4+ T cells of AECOPD patients (n=51). (C) Correlation between ENST0000447867 and RAPGEF3 transcript levels in CD4+ T cells of AECOPD patients (n=51).
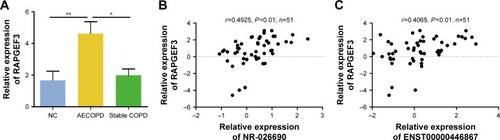
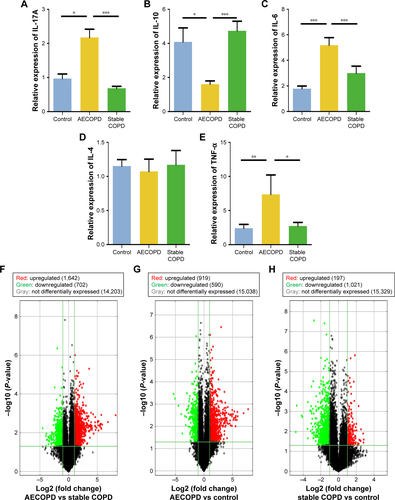
Figure S1 (A–E) The transcript level of cytokines in CD4+ T cells of the different groups was determined by qRT-PCR. *P<0.05, **P<0.01, ***P<0.005. (F–H) After normalization, the volcano plots showed the difference in the expression of lncRNAs between different groups.
Abbreviations: lncRNAs, long noncoding RNAs; AECOPD, acute exacerbation of COPD; qRT-PCR, quantitative real-time reverse transcription-polymerase chain reaction.