Figures & data
Table 1 Patient characteristics
Figure 1 Chronic obstructive pulmonary disease (COPD) management in men and women. Results from cross-tabulations of COPD management distributed by sex.
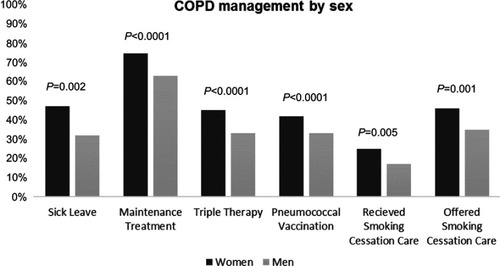
Table 2 Associations of female sex with care-related actions in COPD
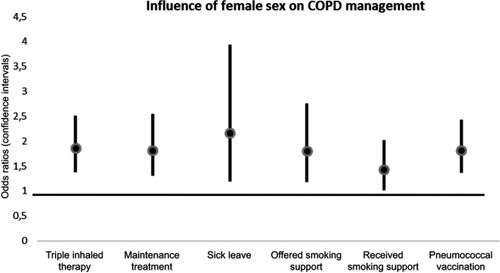
Figure 2 Influence of female sex on care-related actions. Results from logistic regression of the associations of female sex with different care-related actions as dependent variables. The analyses were adjusted for the potential confounders age groups (3 groups), level of education, previous exacerbations or not, mMRC dyspnea scale (≤ or >1), CAT score (< or ≥10), BMI (four groups), comorbidity index (0, 1, 2 or ≥3 comorbid conditions) and self-rated moderate/severe disease or not.
Abbreviations: BMI, body mass index; CAT, Chronic obstructive pulmonary disease Assessment Test; mMRC, modified Medical research council scale.