Figures & data
Table 1 Computed tomography measurements of muscle
Figure 1 Skeletal muscle area on transverse computed tomography images at (A) pectoralis, (B) first lumbar level, and (C) third lumbar level.
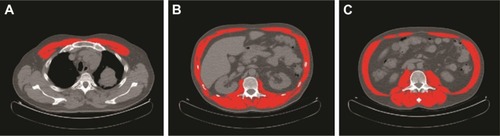
Table 2 Computed tomography measurements of adipose tissue compartments
Figure 2 Kaplan–Meier overall survival curve for patients with loss of muscle mass compared to patients without loss of muscle mass at the level of (A) pectoralis, (B) L1, and (C) L3.
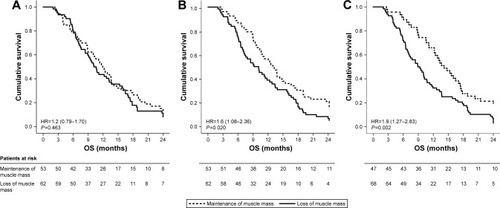
Table 3 Multivariate analysis for predictors of overall survival
Figure S1 Scatter plot and Bland–Altman plot of skeletal muscle with data from pre-chemotherapy scans.
Note: (A) Intermeasurement correlation of pectoralis and L3, (B) Bland–Altman plot of pectoralis and L3, (C) intermeasurement correlation of L1 and L3, and (D) Bland–Altman plot of L1 and L3.
Abbreviations: CSA, cross-sectional area; L1, first lumbar vertebra; L3, third lumbar vertebra.
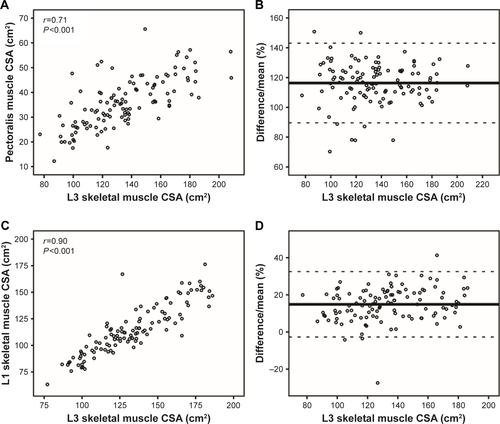
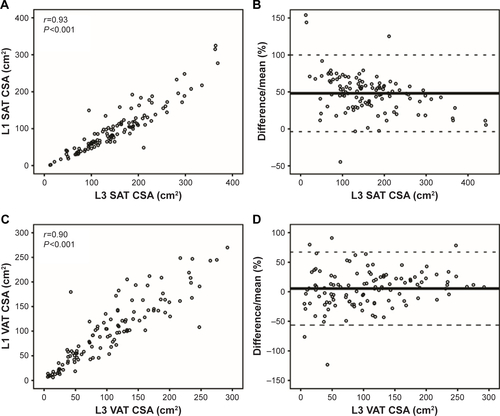
Figure S2 Scatter plot and Bland–Altman plot of adipose tissue with data from pre-chemotherapy scans.
Note: (A) Intermeasurement correlation of SAT at L1 and L3, (B) Bland–Altman plot of SAT at L1 and L3, (C) intermeasurement correlation of VAT at L1 and L3, and (D) Bland–Altman plot of VAT at L1 and L3.
Abbreviations: CSA, cross-sectional area; L1, first lumbar vertebra; L3, third lumbar vertebra; SAT, subcutaneous adipose tissue; VAT, visceral adipose tissue.