Figures & data
Table 1 Characteristics of participants in the GenKOLS study 2003–2005 by GOLD 2011 and GOLD 2017 ABCD classifications
Table 2 GOLD 2011 and GOLD 2017 ABCD classifications by GOLD airflow limitation severity stages 2–4
Table 3 GOLD 2017 ABCD classification by GOLD 2011
Figure 1 Distribution of subjects in GOLD groups. (A) GOLD 2011 classification. (B) GOLD 2017 classification. (C) GOLD 2017 classification, separated by sampling source (250 subjects from general population and 662 from a patient population).
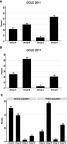
Figure 2 Kaplan–Meier graphs for respiratory mortality for GOLD 2011 and GOLD 2017 ABCD.
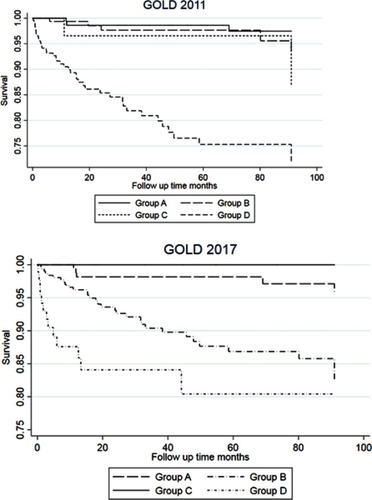
Figure 3 Kaplan–Meier graph for respiratory mortality for GOLD 2017 2A–4D.
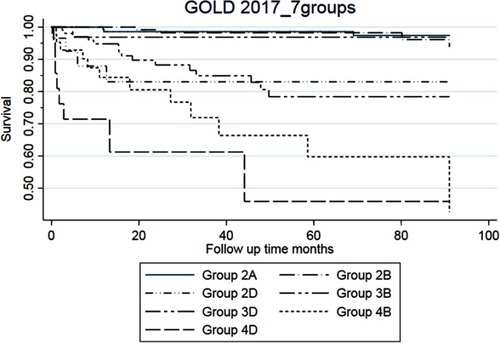
Table 4 Mortality outcomes by GOLD 2011, GOLD 2017 ABCD and GOLD 2017 2A–4D classifications. Univariate and multivariate logistic regression analyses with post hoc receiver operating curve estimations (8-year follow-up of the GenKOLS study)
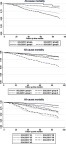
Figure 4 Comparison of univariate area-under-the curve analyses for GOLD 2011, GOLD 2017 ABCD, and GOLD 2017 2A–4D. Separate analyses for all-cause mortality and respiratory mortality.
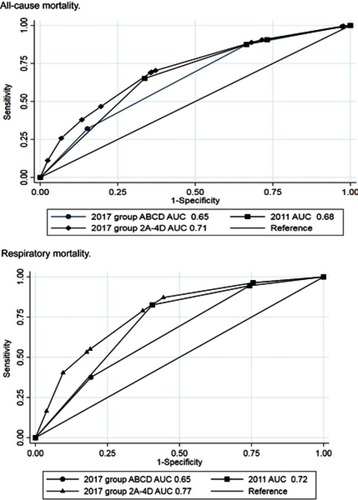
Table 5 All-cause and Respiratory hospitalizations (0 OR≥1) by GOLD 2011 and GOLD 2017 classifications and Univariate and Multivariate logistic regression analyses with post hoc receiver operating curve estimations
Table S1 Characteristics of female participants in the GenKOLS study 2003–2005, by GOLD 2017 classification
Table S2 Characteristics of male participants in the GenKOLS study 2003–2005, by GOLD 2017 classification
Table S3 Mortality outcomes by GOLD 2011 and GOLD 2017 classifications, unadjusted and adjusted cox regression statistics
Table S4 All-cause and respiratory hospitalization by GOLD 2011 and GOLD 2017 classifications, univariate and multivariate* Cox proportional hazards regression analyses
Figure S1 Distribution (%) of female and male by GOLD 2011 classification and by GOLD 2017 classification.
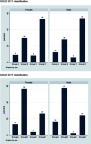
Figure S2 Kaplan–Meier graphs for all-cause mortality according to GOLD 2011, GOLD 2017 ABCD and GOLD 2017 2A–4D.