Figures & data
Table 1 Patient characteristics
Figure 1 Study flowchart.
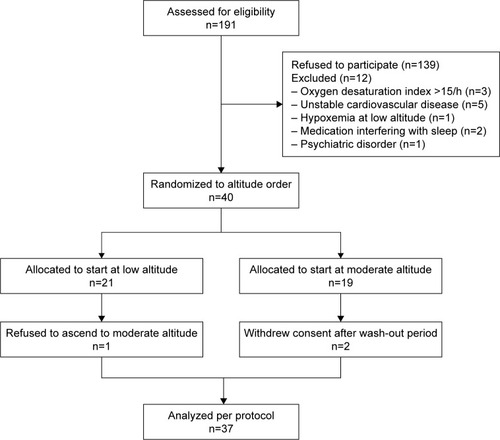
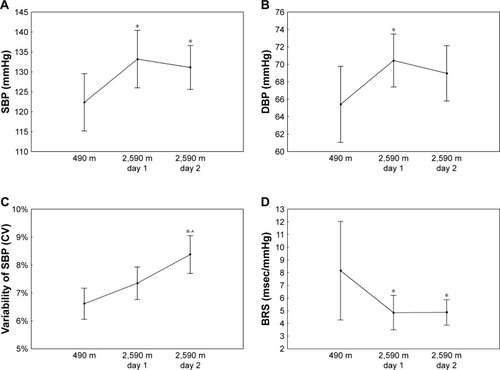
Table 2 ANOVA for repeated measurements
Figure 2 ANOVA of repeated measurements.
Notes: Comparison of (A) SBP, (B) DBP, (C) blood pressure variability, and (D) spontaneous baroreflex sensitivity (BRS) between low altitude and day 1 and day 2 at moderate altitude. Vertical bars denote 95% CIs. *P<0.05 vs 490 m. ^P<0.05 vs 2,590 m day 1.