
Figures & data
Table 1 Patient demographics of the early versus late diagnosis populations
Figure 1 Study cohorts and criteria for early versus late COPD diagnosis. aIndicator diagnosis codes; Pneumonia J10–J18; respiratory diseases J00–J99, excluding pneumonia; oral steroids H02AB; antibiotics for respiratory disease J01AA, J01CA; prescription for respiratory disease R01–R03, R05–R07; lung function measurements from spirometry database and laboratory module in EMR. Disposition of patients by COPD and concomitant asthma versus COPD only is based on diagnosis at any time during the patient’s disease history.
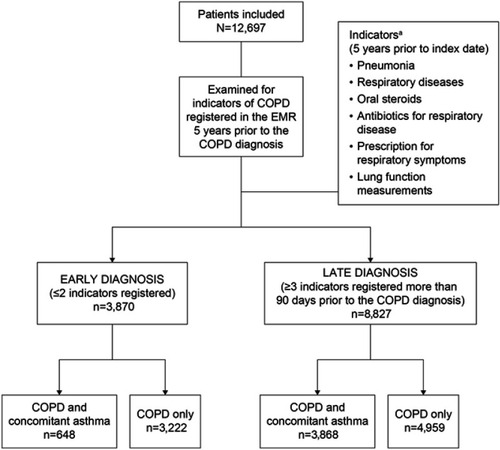
Figure 2 Risk of exacerbations and mortality by stage of diagnosis (early vs late). Risk of exacerbations (A) and mortality (B) in the total population and risk of exacerbations (C) and mortality (D) in patients excluding those with concomitant asthma, in the year following diagnosis.
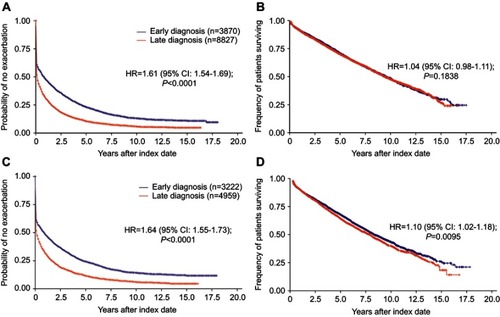
Table 2 Influence of asthma on time to first exacerbation and mortality, early versus late COPD diagnosis
Table 3 Direct health care costs and utilization in patients with early versus late COPD diagnosis
Figure 3 Time trend in direct costs (Euro/year) according to the stage of diagnosis (early vs late). In the year 2007, 2010, 2012 and 2013, total yearly costs were significantly higher for late diagnosis versus early diagnosis.
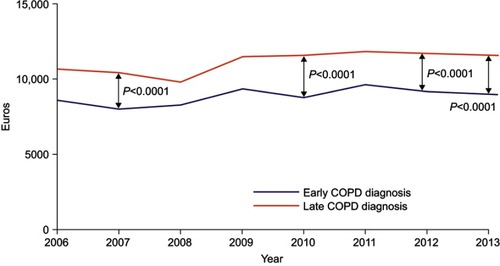
Figure 4 Direct costs during the 2 years after COPD diagnosis by early vs late diagnosis. Costs were calculated from Swedish Krona based on exchange rates in 2013.
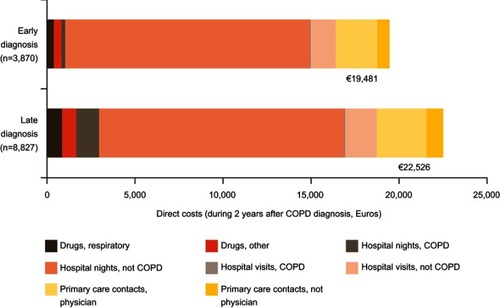
Table 4 Health care resource utilization stratified by a concomitant diagnosis of asthma, early versus late diagnosis
Table S1 Risk of exacerbations and mortality according to the stage of diagnosis (early versus late): total population
Table S2 Risk of exacerbations and mortality according to the stage of diagnosis (early versus late): patients excluding those with concomitant asthma (COPD-only population)
Table S3 Time trend in direct overall costs (Euro/year) according to the stage of diagnosis (early versus late)
Table S4 Health care resource utilization direct costs over 2 years after index date according to stage of diagnosis (late vs early)