
Figures & data
Table 1 Baseline demographics and clinical characteristics
Table 2 Inhaler prescriptions
Figure 1 Percentage of patients within bins of peak inspiratory flow (PIFR), measured against R2 low–medium resistance inhaler (eg, Diskus® and Ellipta®; blue) and R5 high resistance inhaler (Handihaler®; orange).
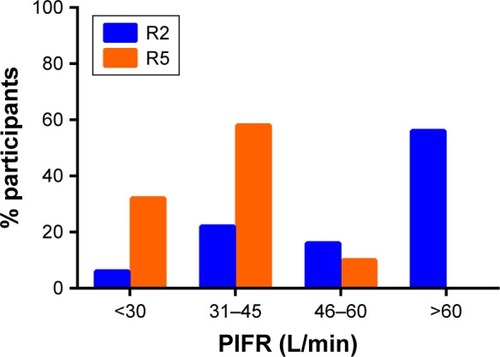
Figure 2 Distribution of patients with suboptimal peak inspiratory flow (PIFR) stratified by Global Initiative for Obstructive Lung Disease (GOLD) FEV1 severity stage, measured against R2 low–medium resistance inhaler (eg, Diskus® and Ellipta®; blue; suboptimal PIFR <60 L/min) and R5 high resistance inhaler (Handihaler®; orange; suboptimal PIFR <30 L/min).
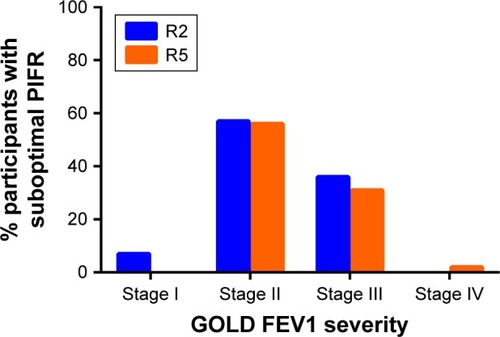
Figure 3 Repeatability of peak inspiratory flow rate (PIFR) from baseline to 2–4 weeks, measured against R2 low–medium resistance inhaler (eg, Diskus® and Ellipta®; blue dashed line) and R5 high resistance inhaler (Handihaler®; orange solid line).
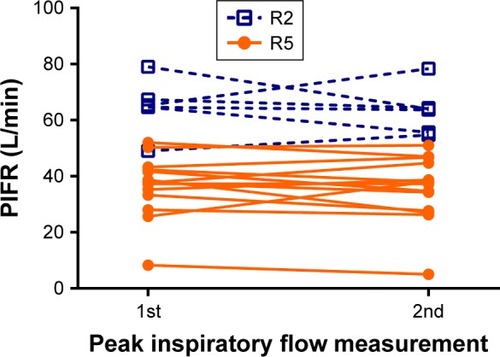
Table 3 Demographics, clinical characteristics, and DPI use in discordant vs concordant participants
Figure S1 Distribution of peak inspiratory flow rate (PIFR) between female and male participants when measured against R2 low–medium resistance inhaler (eg, Diskus® and Ellipta®).
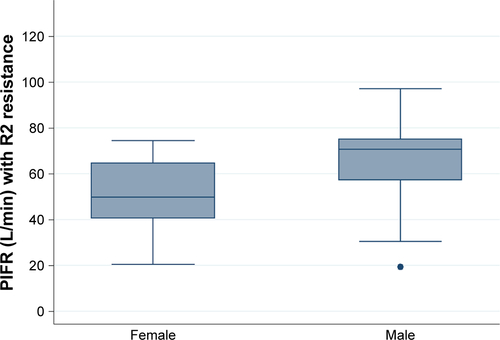
Figure S2 Distribution of peak inspiratory flow rate (PIFR) between female and male participants when measured against R5 high resistance inhaler (Handihaler®).
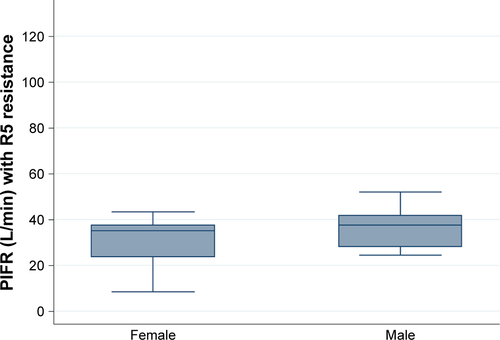
Figure S3 Correlation between height (x-axis) and In-Check™ Dial (y-axis) with R2 low–medium resistance profile inhaler (eg, Diskus® and Ellipta®). Blue line represents fitted line with gray shading 95% CI of fitted line.
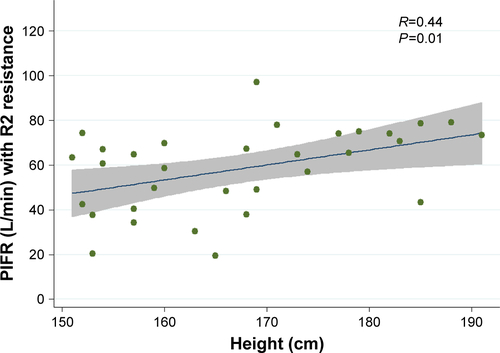
Figure S4 Correlation between height (x-axis) and In-Check™ Dial (y-axis) with R5 high resistance inhaler (Handihaler®). Blue line represents fitted line with gray shading 95% CI of fitted line.
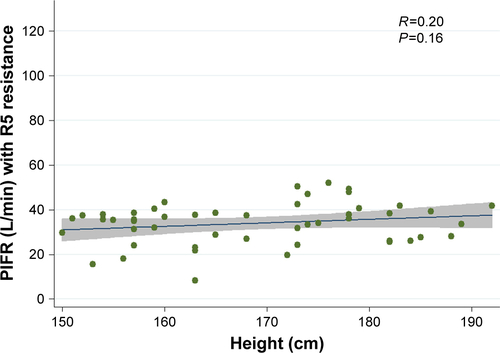
Figure S5 Correlation between peak inspiratory flow rate measured by standard spirometer (x-axis) and In-Check™ Dial (y-axis) with R2 low–medium resistance profile inhaler (eg, Diskus® and Ellipta®). Blue line represents fitted line with gray shading 95% CI of fitted line.
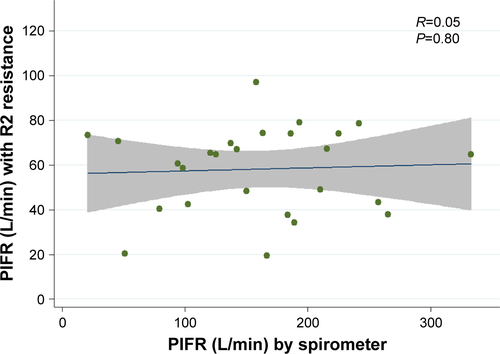
Figure S6 Correlation between peak inspiratory flow rate (PIFR) measured by standard spirometer (x-axis) and In-Check™ Dial (y-axis) with R5 high resistance profile inhaler (Handihaler®). Blue line represents fitted line with gray shading 95% CI of fitted line.
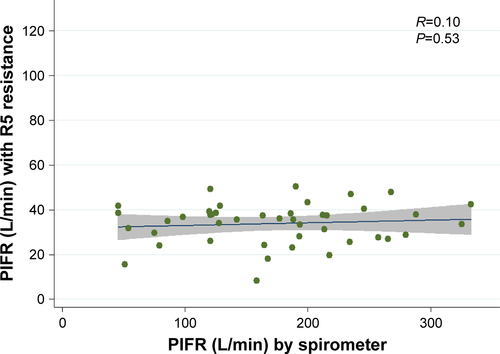
Table S1 Repeatability of PIFR in COPD participants