Figures & data
Table 1 Primer sequences
Figure 1 PM2.5 aggravated smoking-induced histological changes and inflammation in lungs of mice.
Abbreviation: PM2.5, particulate matter ≤2.5 μm.
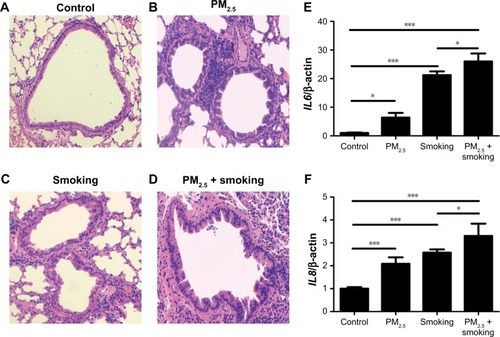
Figure 2 PM2.5 or CSE exposure increased production of cytokines in 16HBE cells.
Abbreviations: PM2.5, particulate matter ≤2.5 μm; CSE, cigarette-smoke extract.
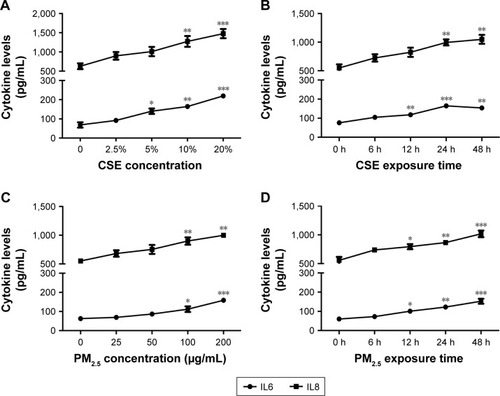
Figure 3 PM2.5 aggravated CSE-induced inflammation in 16HBE cells.
Abbreviations: PM2.5, particulate matter ≤2.5 μm; CSE, cigarette-smoke extract.
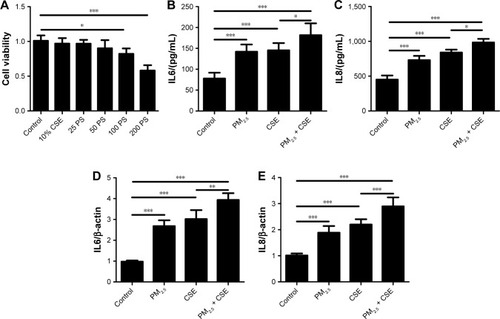
Figure 4 PM2.5 and smoking/CSE exposure upregulated expression of Wnt5a in lungs of mice and 16HBE cells.
Abbreviations: PM2.5, particulate matter ≤2.5 μm; CSE, cigarette-smoke extract.
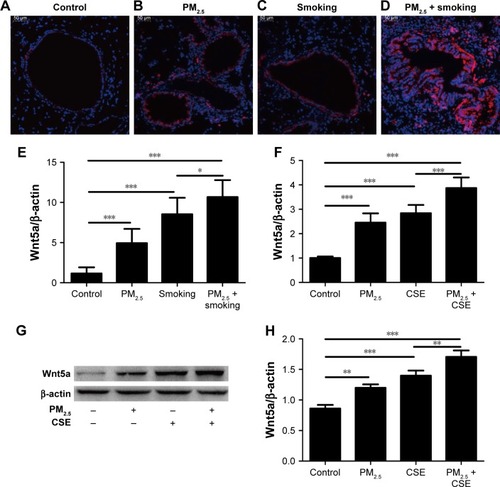
Figure 5 Wnt5a antagonist downregulated levels of proinflammatory cytokines and Wnt5a.
Abbreviation: PM2.5, particulate matter ≤2.5 μm.
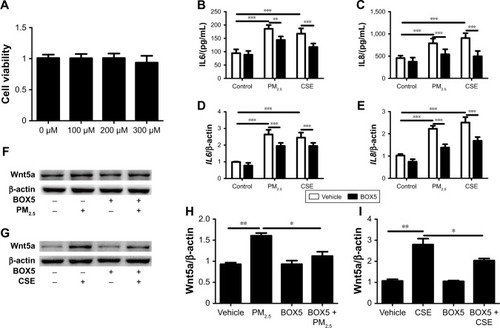
Figure 6 Expression levels of P-ERK1/2 and T-ERK1/2 analyzed by Western blot.
Abbreviations: PM2.5, particulate matter ≤2.5 μm; CSE, cigarette-smoke extract.
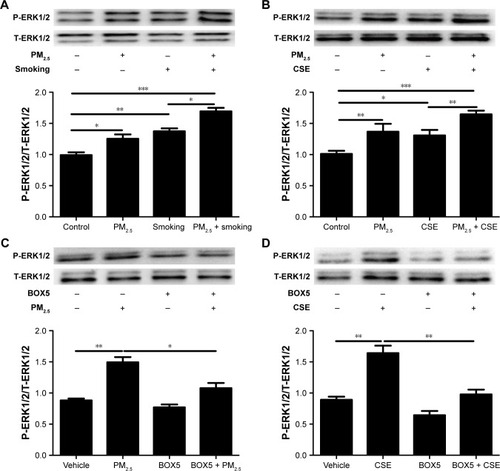
Figure S1 PM2.5 aggravated smoking-induced inflammatory cell infiltration in lungs of mice.
Notes: (A–L) Representative double immunofluorescence–stained lung-tissue sections from control, PM2.5, smoking, and PM2.5 + smoking groups, labeled for Ly6G+ neutrophils (red, A–D), CD3+ T lymphocytes (green, E–H), and composite images (I–L; original magnification 400×, bar 50 μm), using DAPI nuclear counterstain (blue).
Abbreviation: PM2.5, particulate matter ≤2.5 μm.
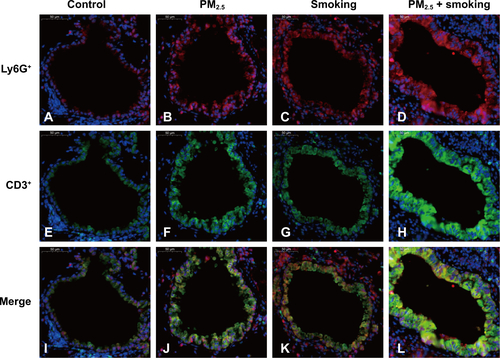
Figure S2 PM2.5 aggravated smoking-induced hyperplasia of alveolar epithelial cells and small-airway epithelia in lungs of mice.
Note: (A–D) Representative immunohistochemistry-stained lung sections from control, PM2.5, smoking, and PM2.5 + smoking group, labeled for PCNA (brown, original magnification 200×, bar 50 μm).
Abbreviation: PM2.5, particulate matter ≤2.5 μm.
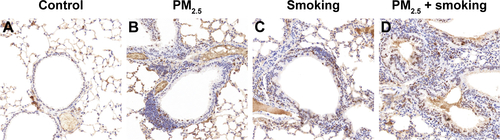
Figure S3 Correlation between levels of Wnt5a and inflammatory factors (IL6 and IL8) in mice and 16HBE cells.
Notes: (A, B) Correlation between levels of Wnt5a and IL6/IL8 in mice (n=5 mice/group); (C, D) correlation between levels of Wnt5a and IL6/IL8 in 16HBE cells. Data represent the relative mRNA expressions of Wnt5a and inflammatory factors in mice or cells. Pearson or Spearman analysis was used to calculate correlation (R)- and P-values.
Abbreviations: PM2.5, particulate matter ≤2.5 μm; 16HBE, 16 human bronchial epithelial cells.
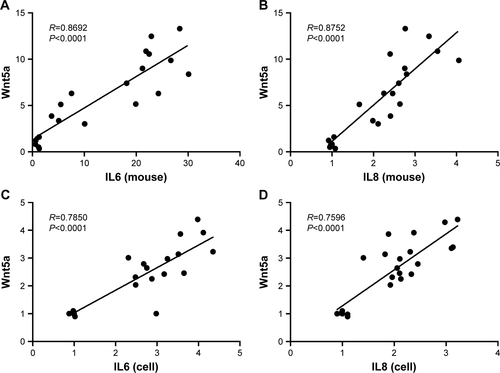
Figure S4 Expression levels of Wnt5a analyzed by Western blot.
Notes: (A, B) Cells preincubated with BOX5 (200 μM) or vehicle (PBS) for 1 hour, then exposed or unexposed to PM2.5 (100 μg/mL) + CSE (10%) for 24 hours (qualitative and quantitative Western blot, β-actin as loading control). Data expressed as mean ± SD. *P<0.05; **P<0.01.
Abbreviations: PM2.5, particulate matter ≤2.5 μm; CSE, cigarette-smoke extract.
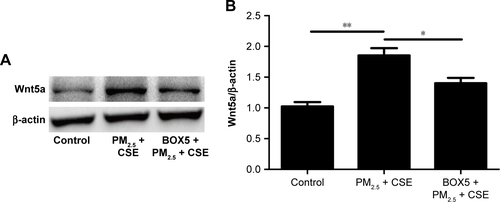
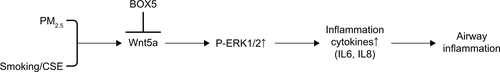
Figure S5 Wnt5a in regulation of airway inflammation induced by PM2.5 and smoking/CSE.
Abbreviations: PM2.5, particulate matter ≤2.5 μm; CSE, cigarette-smoke extract.