Figures & data
Table 1 Patient demographics
Table 2 Patient demographics for epithelial cell donors
Figure 1 In human BALF, leukemia inhibitory factor (LIF) protein is significantly reduced in both smokers and chronic obstructive pulmonary disease (COPD) patients compared to nonsmokers. LIF was measured in lung BALF from age-matched healthy control non-smoker subjects (NS; n=10), smokers (n=30), and subjects with COPD (n=16) by Luminex bead assays. LIF levels were standardized to BALF total protein concentration. Graphs are represented as mean LIF concentration (pg of LIF per µg BALF protein) ± standard error of the mean (SEM) *p<0.05 compared to nonsmoking controls. *p<0.05 comparing both groups connected by a line by Student’s t-tests and corrected with Bonferroni analysis.
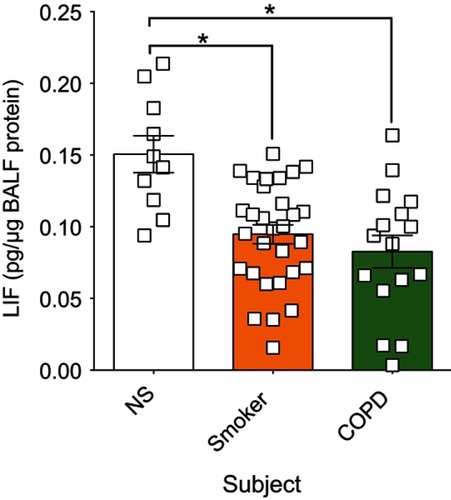
Figure 2 Increased leukemia inhibitory factor (LIF) mRNA instability in chronic obstructive pulmonary disease (COPD) epithelia and proteolytic degradation of LIF protein. (A) Equal concentrations of LIF recombinant protein were incubated with BALF from nonsmokers or COPD patients for 24 hrs and LIF immunoblots were performed. COPD BALF was also pretreated with pefabloc before incubation with LIF recombinant protein. (B) Equal conentrations of LIF recombinant protein were inclubed with various concentrations of neutrophil elastase (NE) for 24 hours and LIF immunoblots were performed. (C) Human bronchial epithelial (HBE) cells from nonsmokers (NS) and COPD patients were treated with Actinomycin D. LIF expression was measured by qPCR. Relative gene expression of LIF was expressed as comparison to time zero of Actinomycin D treatment for NS and COPD samples. (D) Gene silencing was performed for human antigen R (HuR), tristetraprolin (TTP), and dicer in HBE cells from NS and LIF gene expression determined relative to scramble negative control transfected cells. Graph shows the mean ± standard error of the mean (SEM), with each measurement, performed three times on at least four subjects/group. *p<0.05 comparing NS to COPD at each corresponding time point by two-way analysis of variance (ANOVA) with Bonferroni post hoc analysis.
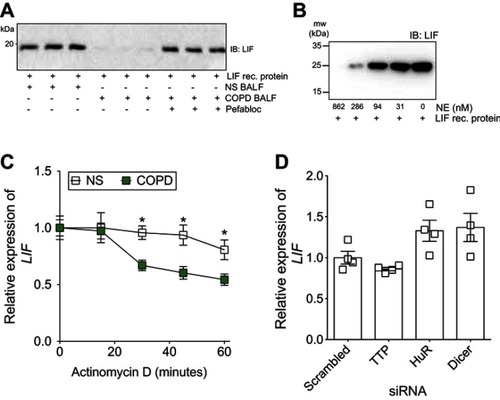
Figure 3 Human bronchial epithelial (HBE) cells isolated from chronic obstructive pulmonary disease (COPD) patients produce less leukemia inhibitory factor (LIF) compared to cells from never smokers during respiratory synctial virus (RSV) infection. Fully differentiated HBE cells grown at the air liquid interface (ALI) from healthy and COPD individuals (n=5/group) were infected with (A) RSV or mock or treated with (B) polyinosinic:polycytidylic acid (poly (i:c)), and RNA and apical surface washes were taken 24 hrs later. (A and B) LIF gene expression was quantified by quantitative polymerase chain reaction (qPCR) and apically release LIF protein from apical surface washing with a Luminex bead assay. Graphs are represented as relative expression of LIF and LIF pg/mL of cell apical surface wash of the mean ± standard error of the mean (SEM), where each assay was performed in triplicate. *p<0.05 compared to mock treated mice by two-way analysis of variance (ANOVA) with Bonferroni post hoc analysis.
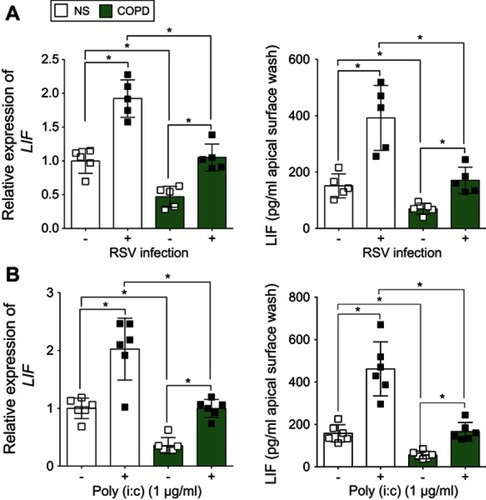
Figure 4 Animals exposed to cigarette smoke had reduced expression of leukemia inhibitory factor (LIF) and its corresponding receptor, LIF receptor (LIFR). Animals were exposed to cigarette smoke for 6 months, immunoblots were performed on whole lung tissues proteins for LIF, LIFR, and β-actin. Densitometry analysis was performed. Graphs are represented as mean ± standard error of the mean (SEM), where each measurement was performed on six animals/group. *p<0.05 comparing both groups by Student’s t-tests.
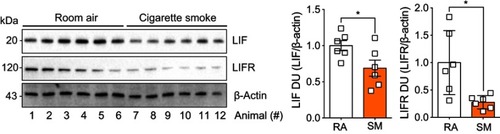
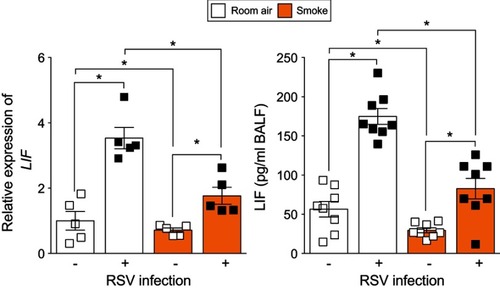
Figure 5 Smoke-exposed animals have reduced lung leukemia inhibitory factor (LIF) expression during respiratory syncytial virus (RSV) infection. Animals were exposed to cigarette smoke for 6 months and then infected with RSV or mock. LIF expression was quantified in whole lung samples by qPCR and in BALF by Luminex bead assay 7-day post-RSV infection. Graphs are represented as mean ± standard error of the mean (SEM), where each measurement was performed on ≥5 animals/group. *p<0.05 comparing both groups connects by a line determined by analysis of variance (ANOVA) with Bonferroni post hoc analysis.