Figures & data
Table 1 Baseline characteristics of the patients and the controls
Figure 1 Serum glucose, insulin concentrations and HOMA-IR index in AECOPD patients, stable COPD patients and the health controls.
Notes: (A) comparison of glucose level; (B) comparison of insulin level; (C) comparison of HOMA-IR. Differences between subject groups were measured by ANOVA with post-hoc analysis performed using Tamhane’s test. (D) Comparison of HbA1C (%). *P-values <0.05.
Abbreviations: AECOPD, acute exacerbation of chronic obstructive pulmonary disease; HOMA-IR, homeostasis model assessment of insulin resistance; ANOVA, one-way analysis of variance.
Abbreviations: AECOPD, acute exacerbation of chronic obstructive pulmonary disease; HOMA-IR, homeostasis model assessment of insulin resistance; ANOVA, one-way analysis of variance.
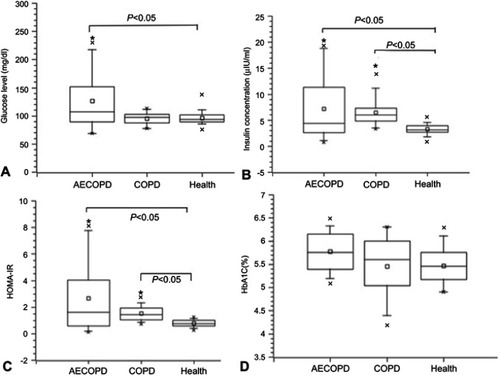
Figure 2 Serum lipids levels of AECOPD patients, stable COPD patients and the health controls.
Notes: (A) comparison of TG level. (B) comparison of CHOL level. (C) comparison of LDL-CHOL level. (D) comparison of HDL-CHOL level. Differences between subject groups were measured by ANOVA with post-hoc analysis performed using Tamhane’s test. *P-values <0.05.
Abbreviations: TG, triglycerides; CHOL, total cholesterol; LDL-CHOL, low density lipoprotein cholesterol HDL-CHOL, high density lipoprotein cholesterol; AECOPD, acute exacerbation of chronic obstructive pulmonary disease; ANOVA, one-way analysis of variance.
Abbreviations: TG, triglycerides; CHOL, total cholesterol; LDL-CHOL, low density lipoprotein cholesterol HDL-CHOL, high density lipoprotein cholesterol; AECOPD, acute exacerbation of chronic obstructive pulmonary disease; ANOVA, one-way analysis of variance.
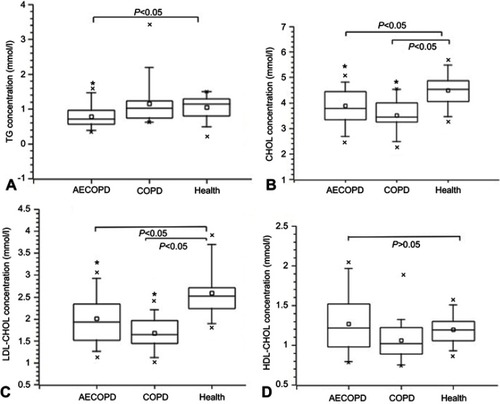
Figure 3 Serum insulin and glucose levels during exacerbations and after recovery in AECOPD patients.
Notes: (A) Comparison of insulin level; (B) Comparison of glucose level; (C) Change of insulin level during exacerbations and after clinical recovery in 22 AECOPD patients; (D) Change of glucose level during exacerbations and after clinical recovery in 22 AECOPD patients. Differences between groups were measured by paired Student's t-test. *P-values <0.05.
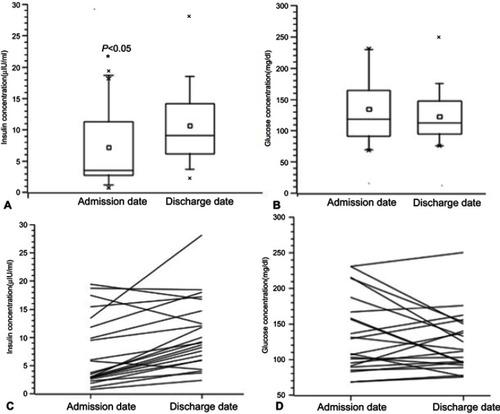
Figure 4 Correlation of amplitude of insulin’s variation with amplitude of glucose’s variation during AE and after recovery.
Notes: Insulin’s variation: recovery-AE glucose’s variation: AE-recovery. Spearman correlation analysis was performed (r=−0.184, P=0.41).
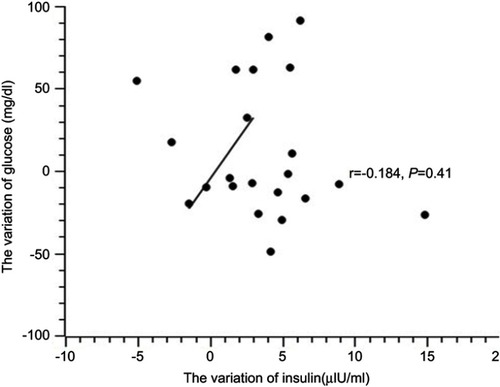
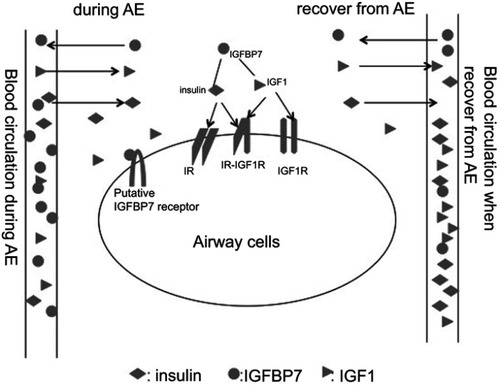
Figure 5 Putative mechanism of insulin-IGF1-IGFBP7 network in AECOPD.
Notes: During AE: insulin and IGF1 flow from blood circulation to airway. IGFBP7 flows from airway to blood circulation. Recover from AE: insulin and IGF1 flow from airway to blood circulation. IGFBP7 flows from blood circulation to airway.
Abbreviations: AE, acute exacerbation; IGFBP7, insulin-like growth factor binding protein 7; IGF1, insulin-like growth factor 1; IR, insulin receptor; IGF1R, insulin-like growth factor 1 receptor.
Abbreviations: AE, acute exacerbation; IGFBP7, insulin-like growth factor binding protein 7; IGF1, insulin-like growth factor 1; IR, insulin receptor; IGF1R, insulin-like growth factor 1 receptor.