Figures & data
Table 1 Baseline characteristics of the study population in subgroups stratified by severity of lung function impairment
Figure 1 Receiver operating characteristic (ROC) curve showing the performance of FEV3 in evaluating bronchodilator test based on FVC evaluation criteria.
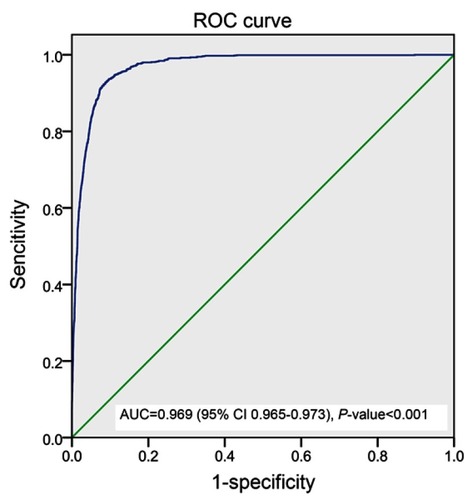
Table 2 Characteristics of bronchodilator response in the study population
Table 3 Characteristics of post-bronchodilator response in subgroups stratified by level of lung function impairment
Figure 2 Frequency distribution of subjects in each group showing post-bronchodilator change in FEV1 of more than 12% of baseline but ≤200 mL in various subgroups stratified by level of lung function impairment.
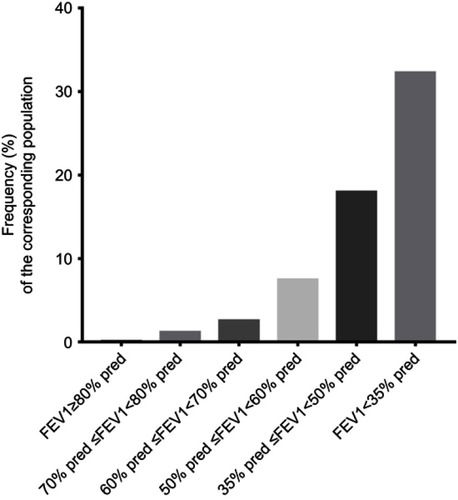
Figure 3 Frequency distribution of subjects in each group whose post-bronchodilator responses become positive with ∆FVC response in various subgroups stratified by level of lung function impairment.
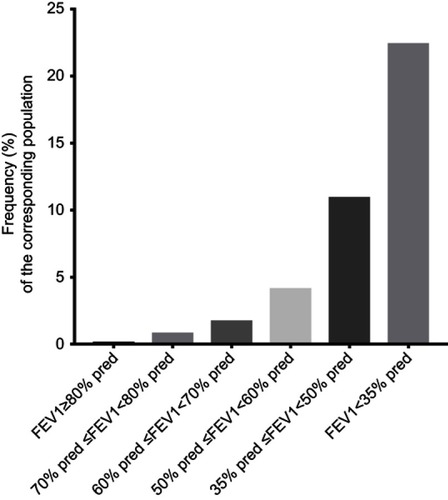
Figure 4 Frequency distribution of subjects in each group whose post-bronchodilator responses become positive with ∆FEV3 response in various subgroups stratified by level of lung function impairment.
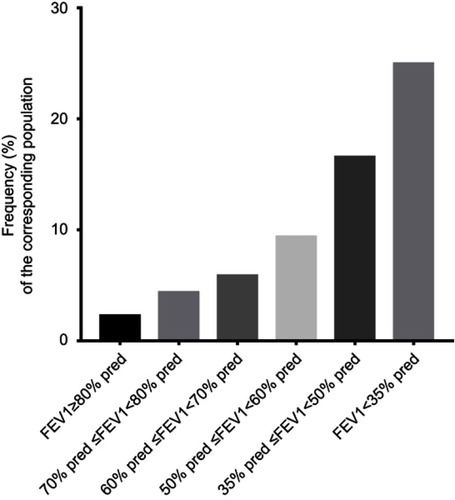
Table 4 Spirometric Indexes expressed as change post-bronchodilator and z scores in subgroups stratified by level of lung function impairment
Table 5 Spirometric Indexes in male subjects expressed as change in post-bronchodilator and z scores in subgroups stratified by level of lung function impairment
Table 6 Spirometric Indexes in female subjects expressed as change in post-bronchodilator and z-scores in subgroups stratified by level of lung function impairment
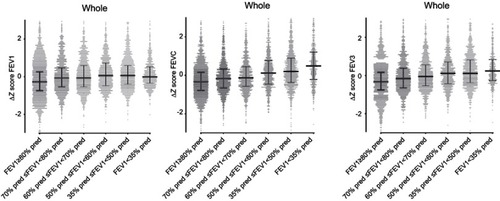
Figure 5 Post-bronchodilator change in z score of FEV1 (left) is larger in 70% pred≤FEV1<80% pred group, 60% pred≤FEV1<70% pred group and 50% pred≤FEV1<60% pred group compared with FEV1≥80% pred group and declines as obstruction becomes most severe. Conversely, the post-bronchodilator effect on FVC (middle) increased with the severity of lung function impairment. The patterns for FEV3 and FVC are similar. Thin lines, 5th and 95th percentiles; central thick line, median.